. 2015 May 14:5:9659.
doi: 10.1038/srep09659.

Role of the Tau N-terminal region in microtubule stabilization revealed by new endogenous truncated forms

Affiliations

Role of the Tau N-terminal region in microtubule stabilization revealed by new endogenous truncated forms

Maxime Derisbourg et al. Sci Rep. .

Abstract

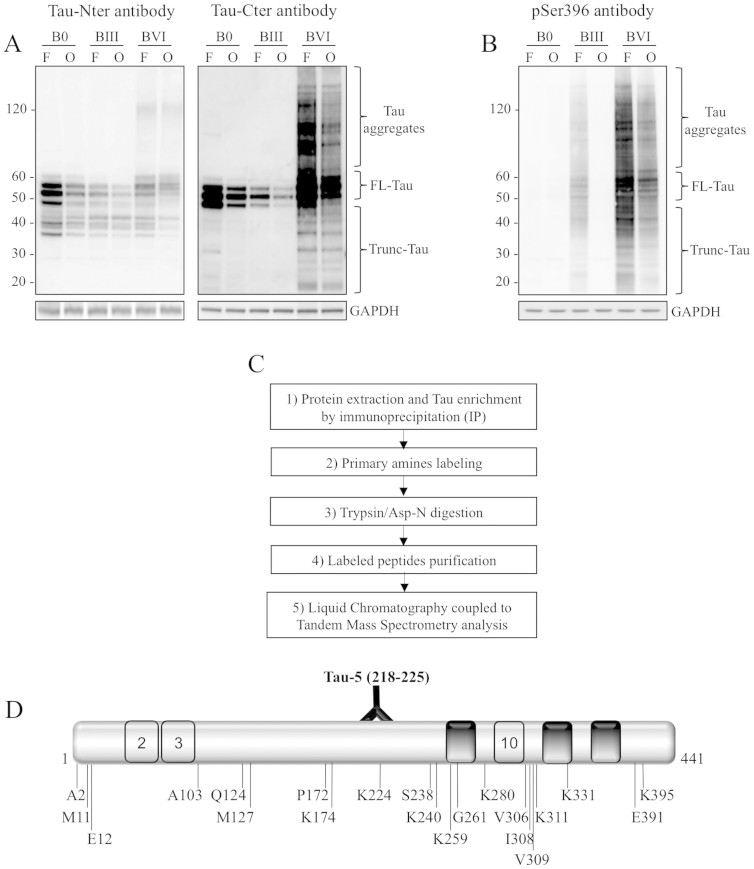
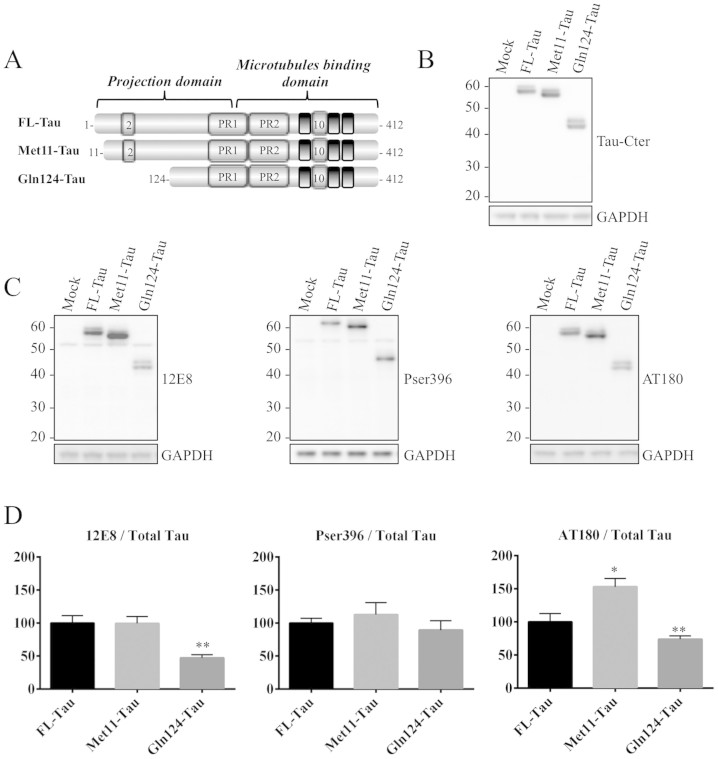
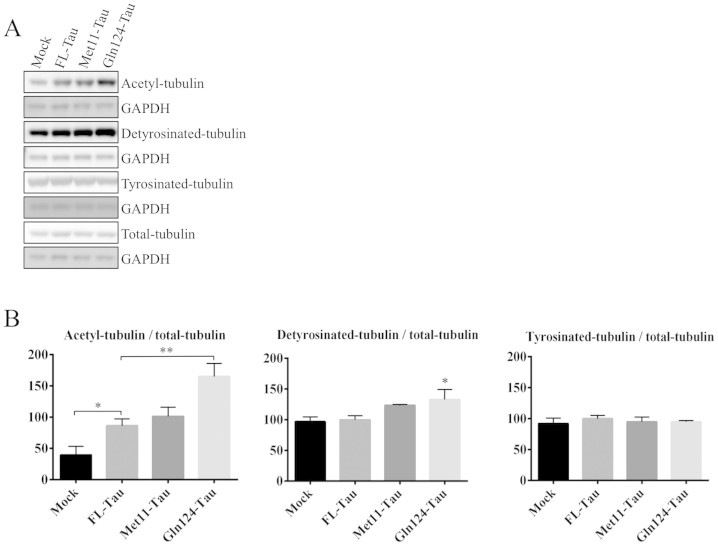
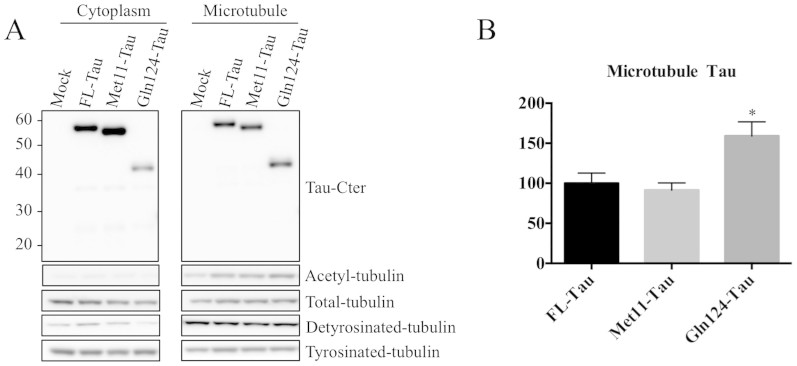
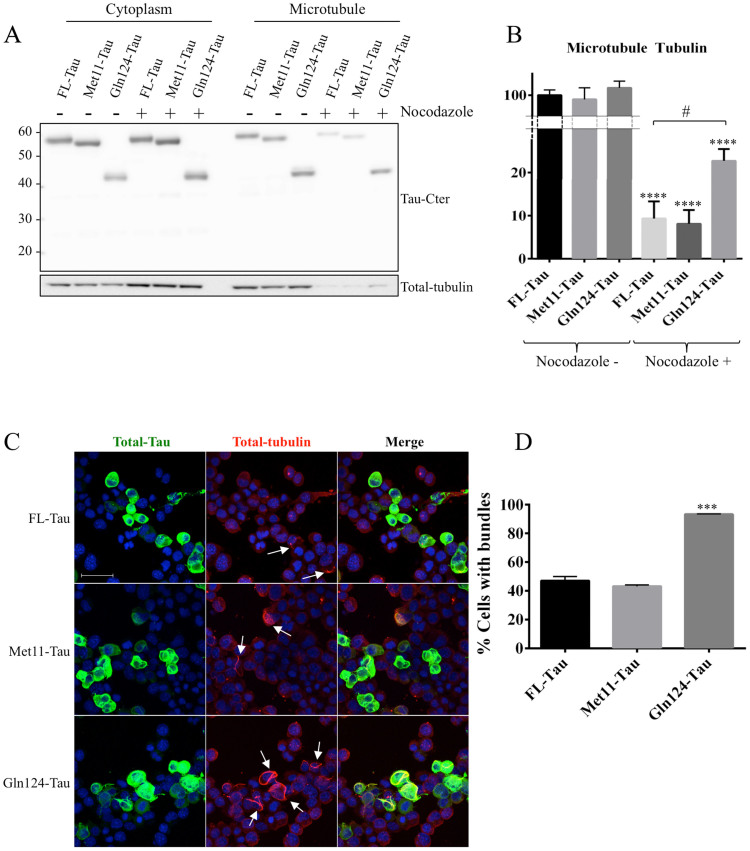
Tau is a central player in Alzheimer's disease (AD) and related Tauopathies, where it is found as aggregates in degenerating neurons. Abnormal post-translational modifications, such as truncation, are likely involved in the pathological process. A major step forward in understanding the role of Tau truncation would be to identify the precise cleavage sites of the several truncated Tau fragments that are observed until now in AD brains, especially those truncated at the N-terminus, which are less characterized than those truncated at the C-terminus. Here, we optimized a proteomics approach and succeeded in identifying a number of new N-terminally truncated Tau species from the human brain. We initiated cell-based functional studies by analyzing the biochemical characteristics of two N-terminally truncated Tau species starting at residues Met11 and Gln124 respectively. Our results show, interestingly, that the Gln124-Tau fragment displays a stronger ability to bind and stabilize microtubules, suggesting that the Tau N-terminal domain could play a direct role in the regulation of microtubule stabilization. Future studies based on our new N-terminally truncated-Tau species should improve our knowledge of the role of truncation in Tau biology as well as in the AD pathological process.


Figures

Figure 1
Figure 1. Identification of 21 N-terminal truncation sites of Tau protein from human brain tissue using LC-MS/MS.
(A): Characterization of human brain tissue by WB using antibodies directed against the Tau C-terminal (Tau-Cter) and N-terminal (Tau-Nter) ends; representative analysis of tissue from the frontal (F) and occipital (O) cortex of Braak 0 (B0), Braak III (BIII) and Braak VI (BVI) patients. GAPDH was used as a loading control. (B): Characterization of the same human brain tissue by WB using pSer396 antibody. The gels displayed in A and B have been run under the same experimental conditions. Cropped blots are displayed; Full-length blots are presented in supplementary data (as Fig. S7A and Fig. S7B respectively). (C): Proteomics approach developed to identify N-terminal sites of Tau protein; Tau species were immuno-enriched from the human occipital and frontal cortex, labeled with covalently-linked biotin, digested either with trypsin or with Asp-N and analyzed by LC-MS/MS. (D): Representation of the position of identified cleavage sites as well as of the Tau-5 antibody epitope on a schematic Tau sequence (numbering according to the longest Tau isoform).
Figure 2
Figure 2. Expression and phosphorylation pattern of truncated Tau proteins.
(A): Schematic representation of 1N4R FL-Tau isoform, which includes exons 2 and 10, and the Met11-Tau and Gln124-Tau fragments. PR: proline rich domain. (B): Representative WB analysis using the Tau-Cter antibody of protein extracts from N1E-115 cells transfected with control vector (mock), FL-Tau and the Met11-Tau and Gln124-Tau fragments. GAPDH was used as a loading control. (C-D) Representative WB analysis and densitometric quantifications of phosphorylated epitopes (AT180: pThr231; 12E8: pSer252-pSer356 and pSer396). Quantification was performed by calculating the ratio of phosphorylated Tau to total Tau (Tau-Cter), both relative to GADPH. Error bars indicate SEM. N ≥ 3 independent experiments. *: P ≤ 0.05; **: P ≤ 0.01. Differences between mean values were determined using One-way ANOVA followed by Fisher's LSD post hoc test. The gels displayed in B and C has been run under the same experimental conditions. Cropped blots are displayed; Full-length blots are presented in supplementary data (as Fig. S8A and S8B, respectively).
Figure 3
Figure 3. Gln124-Tau increases α-tubulin acetylation and detyrosination.
(A): Post-translational modifications of α-tubulin analyzed by WB using protein extracts from N1E-115 cells overexpressing FL-Tau, Met11-Tau or Gln124-Tau. The gels have been run under the same experimental conditions. Cropped blots are displayed; Full-length blots are presented in supplementary data (as Fig. S9). (B): Quantification was performed by calculating the ratio of modified tubulin to total tubulin, both relative to GAPDH. Error bars indicate SEM. N ≥ 5 independent experiments. *: P ≤ 0.05; **: P ≤ 0.01. Differences between mean values were determined using One-way ANOVA followed by Fisher's LSD post hoc test.
Figure 4
Figure 4. Gln124-Tau binds more efficiently to microtubules than FL-Tau.
(A): Representative WB analysis of microtubule fractions from N1E-115 cell extracts transiently transfected with FL-Tau, Met11-Tau or Gln124-Tau fragments. The purity of the fractions was evaluated using an antibody to acetylated α-tubulin. The gels have been run under the same experimental conditions. Cropped blots are displayed; Full-length blots are presented in supplementary data (as Fig. S10). (B): Quantification was performed by calculating the ratio of microtubule-associated Tau to total Tau. Error bars indicate SEM. N ≥ 3 independent experiments. *: P ≤ 0.05. Differences between mean values were determined using One-way ANOVA followed by Fisher's LSD post hoc test.
Figure 5
Figure 5. Gln124 protects cells more effectively against microtubule depolymerization than FL-Tau.
(A): Representative analysis of Tau species and total tubulin distribution in microtubule fractions, performed after 20 minutes of nocodazole treatment. (B): Quantification was performed by calculating the ratio of tubuline present in the microtubule fraction to total tubuline. The Cropped blots are displayed; Full-length blots are presented in supplementary data (as Fig. S11). (C): Confocal imaging of N15-115 cells transfected with Tau and the truncated species Met11-Tau and Gln124-Tau, and treated with nocodazole. Cells harbor bundles are designated by white arrows. Scale bar: 50 μM. (D): Quantification of cells expressing Tau, Met11-Tau or Gln124-Tau which display bundles after 20 minutes of nocodazole treatment. Error bars indicate SEM. N ≥ 3 independent experiments. ***: P ≤ 0.001. Differences between mean values were determined using One-way ANOVA followed by Fisher's LSD post hoc test.

References

    1. Andreadis A., Brown W. M. & Kosik K. S. Structure and novel exons of the human tau gene. Biochemistry 31, 10626–10633 (1992). - PubMed
    1. Goedert M., Spillantini M. G., Jakes R., Rutherford D. & Crowther R. A. Multiple isoforms of human microtubule-associated protein tau: sequences and localization in neurofibrillary tangles of Alzheimer's disease. Neuron 3, 519–526 (1989). - PubMed
    1. Himmler A., Drechsel D., Kirschner M. W. & Martin D. W. Tau consists of a set of proteins with repeated C-terminal microtubule-binding domains and variable N-terminal domains. Mol. Cell. Biol. 9, 1381–1388 (1989). - PMC - PubMed
    1. Drechsel D. N., Hyman A. A., Cobb M. H. & Kirschner M. W. Modulation of the dynamic instability of tubulin assembly by the microtubule-associated protein tau. Mol. Biol. Cell 3, 1141–1154 (1992). - PMC - PubMed
    1. Stamer K., Vogel R., Thies E., Mandelkow E. & Mandelkow E. M. Tau blocks traffic of organelles, neurofilaments, and APP vesicles in neurons and enhances oxidative stress. The Journal of Cell Biology 156, 1051–1063 (2002). - PMC - PubMed

Publication types