. 2015 May 14;10(5):e0125624.
doi: 10.1371/journal.pone.0125624. eCollection 2015.

Two Hydroxyproline Galactosyltransferases, GALT5 and GALT2, Function in Arabinogalactan-Protein Glycosylation, Growth and Development in Arabidopsis

Affiliations

Two Hydroxyproline Galactosyltransferases, GALT5 and GALT2, Function in Arabinogalactan-Protein Glycosylation, Growth and Development in Arabidopsis

Debarati Basu et al. PLoS One. .

Abstract

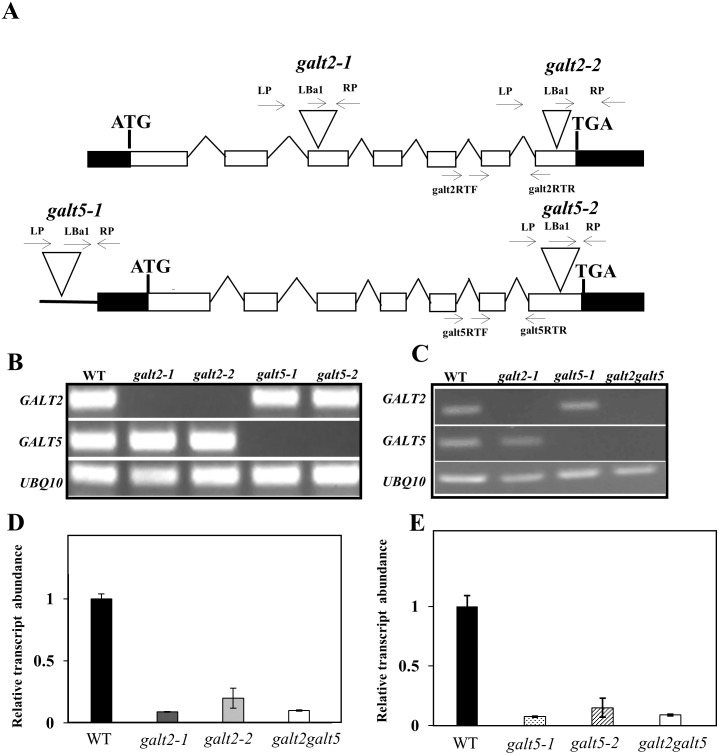
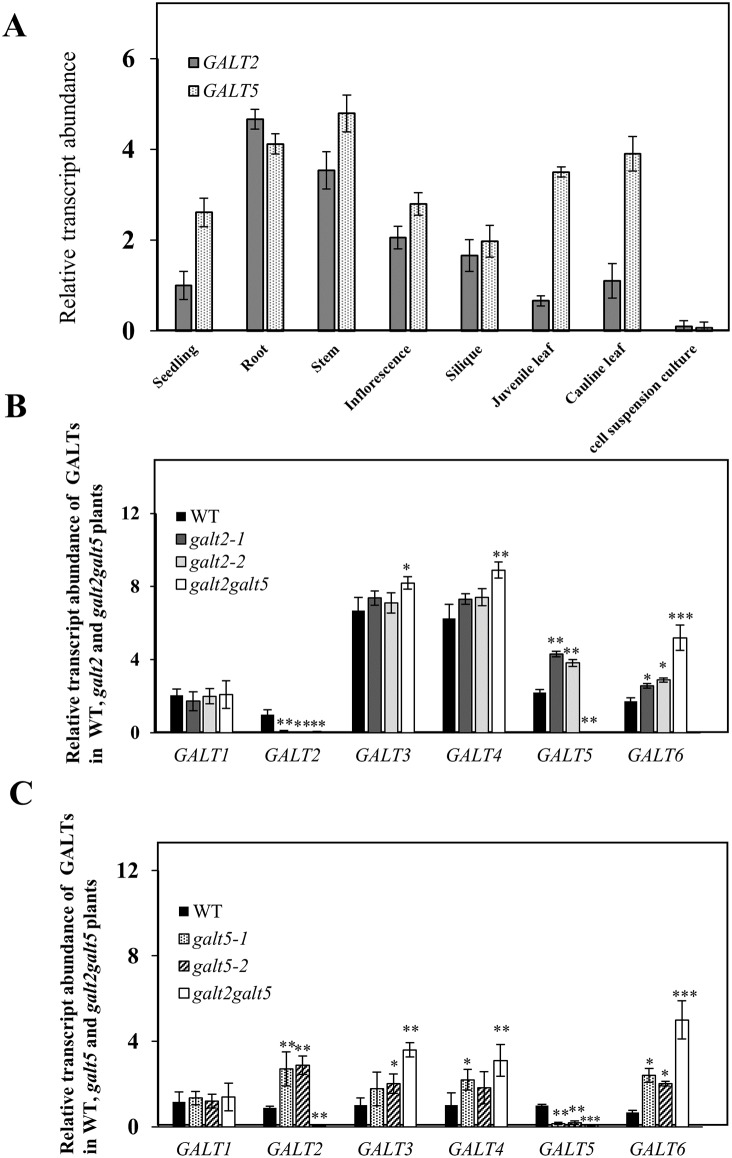
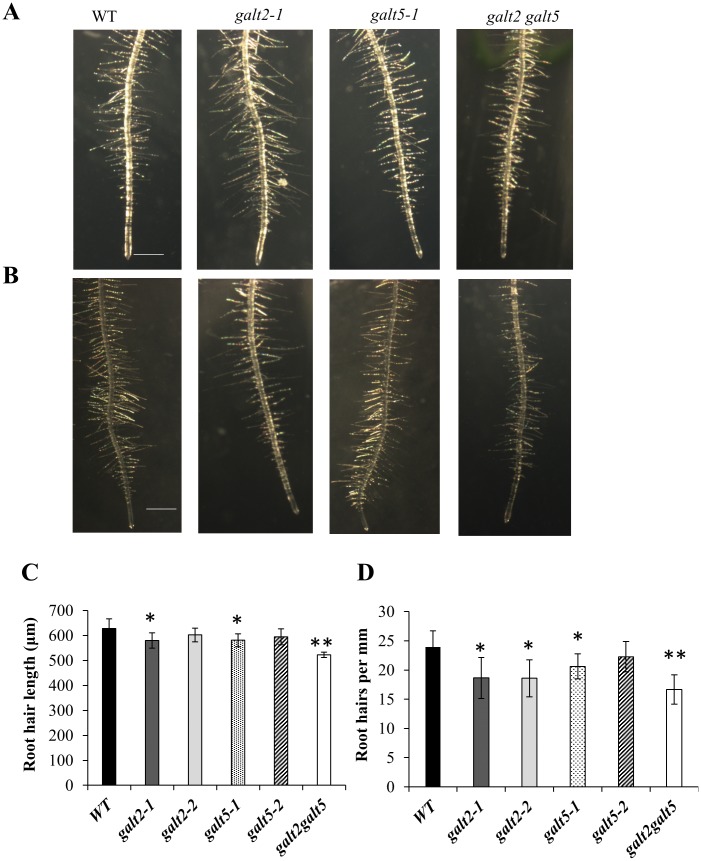
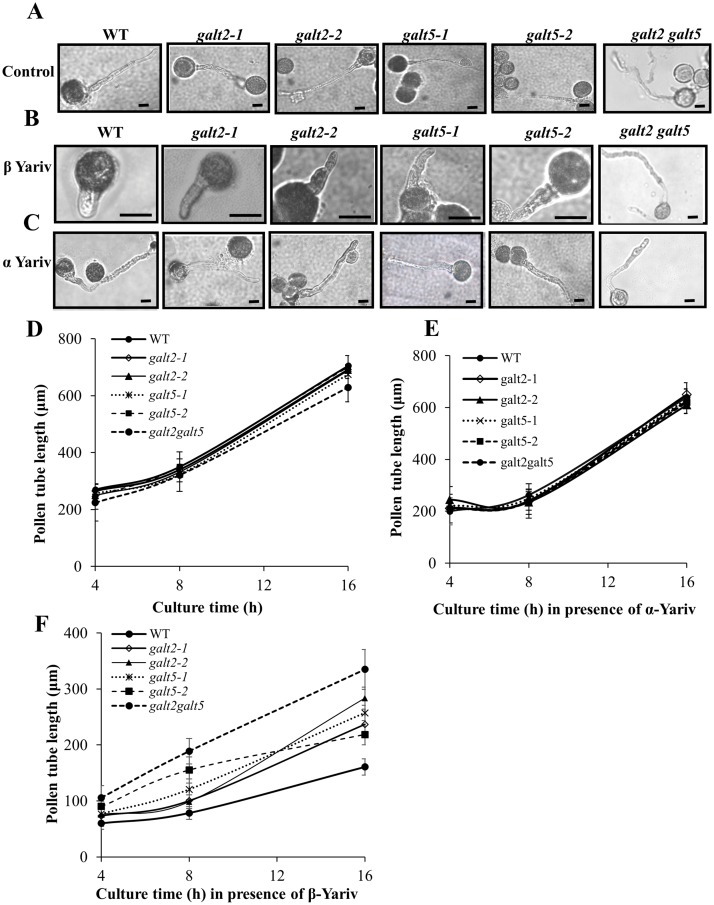
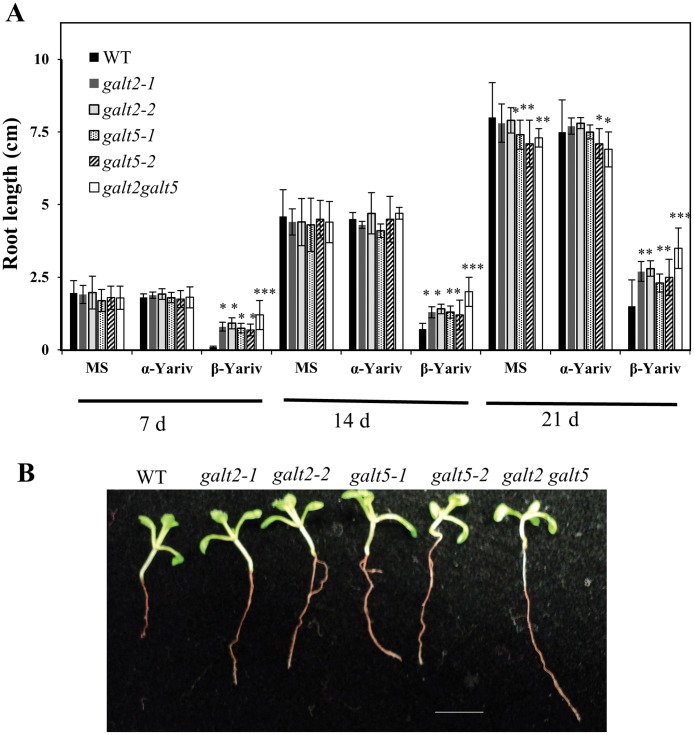
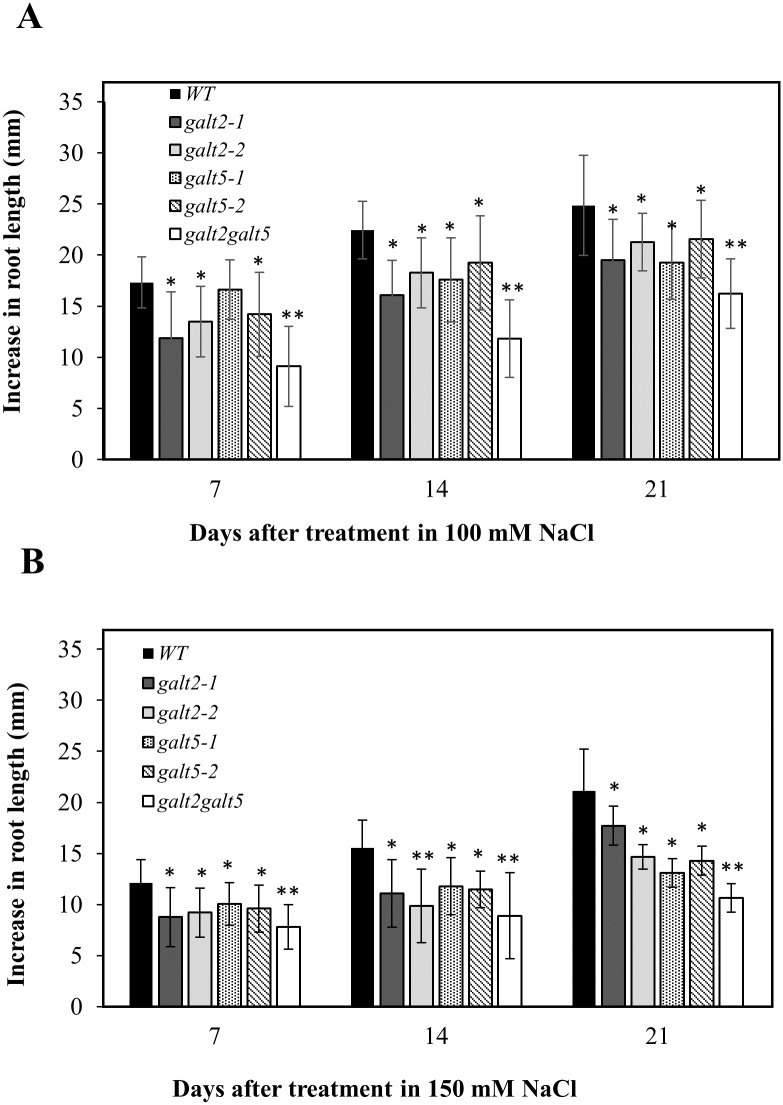
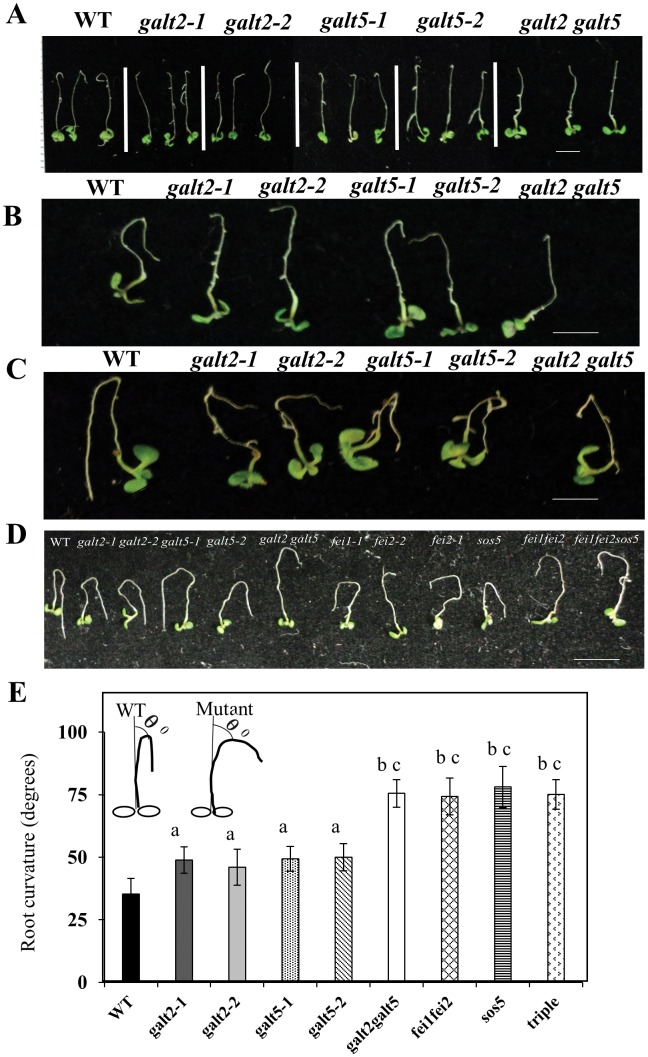
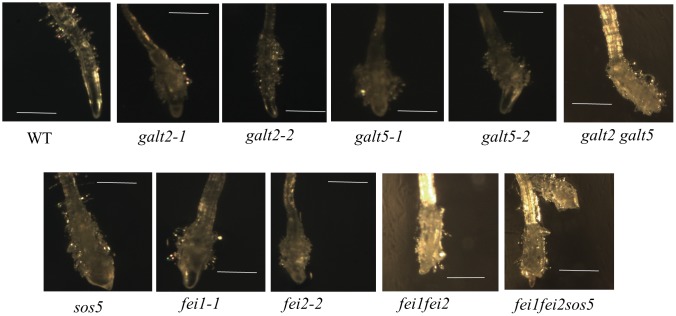
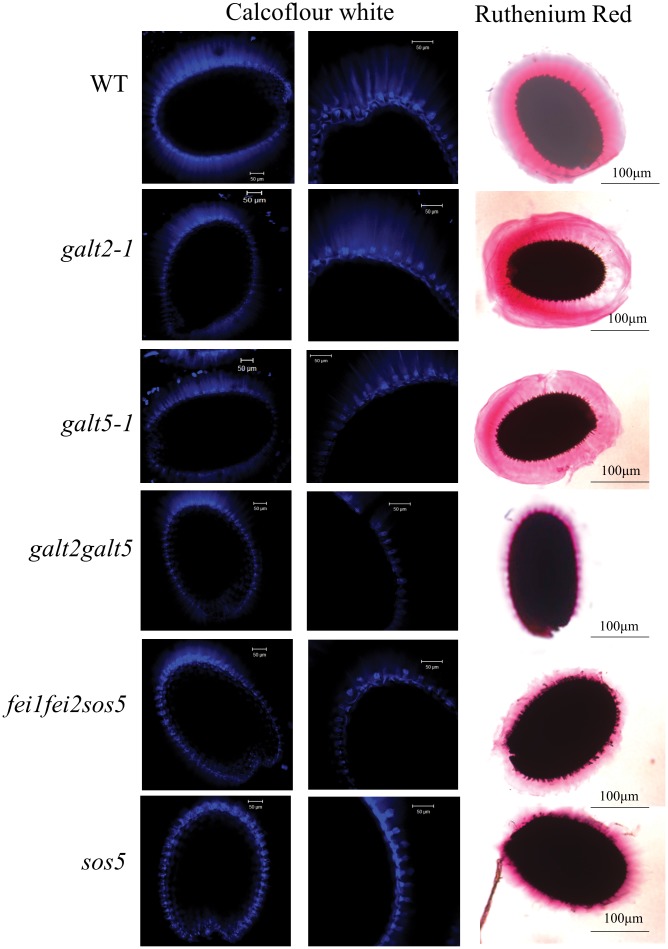
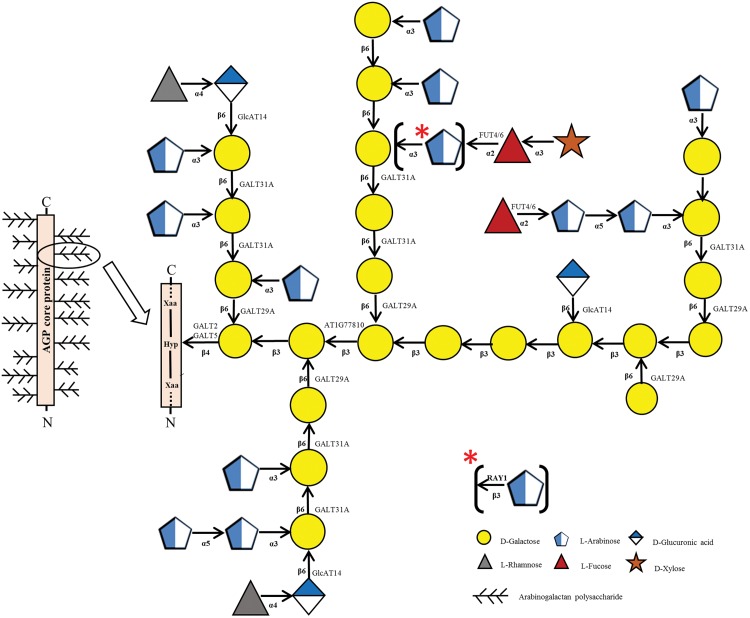
Hydroxyproline-O-galactosyltransferase (GALT) initiates O-glycosylation of arabinogalactan-proteins (AGPs). We previously characterized GALT2 (At4g21060), and now report on functional characterization of GALT5 (At1g74800). GALT5 was identified using heterologous expression in Pichia and an in vitro GALT assay. Product characterization showed GALT5 specifically adds galactose to hydroxyproline in AGP protein backbones. Functions of GALT2 and GALT5 were elucidated by phenotypic analysis of single and double mutant plants. Allelic galt5 and galt2 mutants, and particularly galt2 galt5 double mutants, demonstrated lower GALT activities and reductions in β-Yariv-precipitated AGPs compared to wild type. Mutant plants showed pleiotropic growth and development phenotypes (defects in root hair growth, root elongation, pollen tube growth, flowering time, leaf development, silique length, and inflorescence growth), which were most severe in the double mutants. Conditional mutant phenotypes were also observed, including salt-hypersensitive root growth and root tip swelling as well as reduced inhibition of pollen tube growth and root growth in response to β-Yariv reagent. These mutants also phenocopy mutants for an AGP, SOS5, and two cell wall receptor-like kinases, FEI1 and FEI2, which exist in a genetic signaling pathway. In summary, GALT5 and GALT2 function as redundant GALTs that control AGP O-glycosylation, which is essential for normal growth and development.


Conflict of interest statement

Competing Interests: The authors have declared that no competing interests exist.

Figures

Fig 1
Fig 1. RP-HPLC fractionation of the [AO]7:GALT5 reaction products on a PRP-1 reverse-phase column.
Acceptor substrate alone (A and D), GALT reaction with microsomal membranes from the NC Pichia line transformed with the empty expression vector (B and E) and the GALT reaction with microsomal membranes from the transgenic Pichia C5 line (C and F) were fractionated by RP-HPLC using identical elution conditions. Radioactive Peak II coeluted with the [AO]7 and d[AO]51 acceptor substrates in the GALT5 reaction and was used for subsequent product analysis.
Fig 2
Fig 2. Bio-gel P2 fractionation of the RP-HPLC purified [AO]7:GALT5 reaction product and High-Performance Anion-Exchange Chromatography (HPAEC) of the resulting base hydrolysis product.
(A) Bio-gel P2 fractionation of the RP-HPLC purified [AO]7:GALT5 reaction product before and after base hydroylysis. Permeablized microsomal membranes from the Pichia C5 line expressing 6x His-GALT5 served as the enzyme source in the [AO]7:GALT5 reaction. Elution profiles of the reaction product before and after base hydrolysis are shown. The column was calibrated with high-M r dextran (V0), galactose (Vt), xylo-oligosaccharides with degree of polymerization (DP) 2 to 5 and xyloglucan-oligosaccharides (DP6-9); their elution positions are indicated with arrows at the top of the figure. The elution position of free Hyp amino acid (corresponding to DP3) is shown with an arrow in the panel. Base hydrolysis produces a radioactive peak eluting at DP4, which corresponds to Hyp-Gal. (B) HPAEC profile of a chemically synthesized Hyp-Gal standard detected as a PAD response. (C) The radioactive peak eluting at DP4 coelutes with the chemically synthesized Hyp-Gal standard following HPAEC. Both the Hyp-Gal standard and the radioactive peak eluting at DP4 were fractionated in 5 mM NaOH elution buffer on a CarboPac PA-20 column.
Fig 3
Fig 3. Effect of various peptide and polysaccharide acceptor substrates on incorporation of [14C]radiolabeled galactose.
Permeablized microsomal membranes from the NC Pichia line transformed with the empty expression vector and the C5 Pichia line expressing 6x His-GALT5 served as the enzyme source in the GALT reactions. [AO]7, [AO]14, and d[AO]51 contain 7, 14, and 51 [AO] units, respectively. A chemically synthesized extensin peptide (ExtP) contains repetitive SO4 units. [AP]7 contains 7 [AP] units. Rhamnogalactan I (RGI) from potato and RG from soybean represent pectin polymer substrates. Enzyme reactions using UDP-[14C]Gal as the sugar donor were done in triplicate and mean values ±SE are presented.
Fig 4
Fig 4. Subcellular localization of GALT5 in tobacco leaf epidermal cells observed 5 days after infiltration.
Transiently expressed GALT5-YFP co-localized with sialyltransferase (ST)-GFP fusion protein (a Golgi marker) as well as with HDEL-GFP fusion protein (an ER marker). These constructs were examined by laser-scanning confocal microscopy under fluorescent and white light, and the fluorescent images were merged to observe co-localization. Bar = 10μm.
Fig 5
Fig 5. Molecular characterization of galt single and double mutants.
(A) GALT2 and GALT5 gene structure and T-DNA insertion sites in galt2-1, galt2-2, galt5-1 and galt5-2 mutants. The intron-exon structures of GALT2 and AGALT5 are indicated (introns are drawn as lines and exons as rectangles, with white rectangles representing coding sequences and black rectangles representing UTRs). Sites of T-DNA insertions in galt2 and galt5 are marked (triangles) as are the locations of primer sequences (arrows) used for PCR screening. (B) RT-PCR analysis of transcripts from rosette leaves of 14-d-old wild type (Col-0), the allelic homozygous galt2 and galt5 mutant lines. Arrows indicate the position of primers used for RT-PCR analysis of transcript levels. UBQ10 primers were used as internal controls. (C) RT-PCR analysis of transcripts from rosette leaves of 14-d-old wild type (Col-0), the homozygous galt2 and galt5 mutant lines used for producing the double mutant, and the galt2 galt5 double mutant. (D) and (E) Quantitative RT-PCR analysis to detect GALT2 and GALT5 transcript abundance in the galt mutants. Total RNA was isolated from rosette leaves of 14-d-old wild type, galt2-1, galt2-2, galt5-1, galt5-2, and galt2 galt5 plants. UBQ10 primers were used as controls. Data were normalized to the level of wild type GALT2 expression in panel D and wild type GALT5 expression in panel E, which was set to 1 arbitrary unit (a.u.) in each case. Means ± SE of three biological replicates (n = 3) are shown.
Fig 6
Fig 6. Organ-specific expression of GALT2 and GALT5 and gene compensation in galt2, galt5 and galt2 galt5 mutants observed by quantitative RT-PCR analysis.
(A) Organ-specific relative expression of GALT2 and GALT5 genes. qPCR was performed with total RNA samples from roots, stem, inflorescence, silique, seedling, cell culture, cauline leaves, and juvenile rosette leaves. The averages of three biological replicates are shown. The y axis shows x-fold expression with respect to the lowest encountered value of GALT2 expression in seedling equal to one arbitrary unit (a.u.). (B) Functional compensation of galt2 and galt2 galt5 as revealed by qPCR analysis. Data were normalized to the level of GALT2 expression in seedlings of wild type, which was set to 1 arbitrary unit (a.u.). RNA was isolated from 14-d-old seedlings. (C) Functional compensation of galt5 and galt2 galt5 as revealed by qPCR analysis. The expression values were normalized to the level of GALT5 expression in seedlings of wild type, which was set to 1 arbitrary unit (a.u.). UBQ10 was used as an internal control for all the qPCR experiments. The asterisks indicate significant differences in expression of transcripts of the six GALTs tested compared with wild type according to a Student's t test (*, P < 0.05; **, P < 0.01, ***, P<0.001).
Fig 7
Fig 7. Root hair length and density reduced in the galt2 galt5 double mutant.
(A) Wild type, galt2-1, galt5-1, and galt2 galt5 plants were grown on MS agar plates for 10 d with 1% sucrose or (B) with 4.5% sucrose. Bars = 1mm. (C) Quantification of root hair length and (D) density of the galt mutants. The asterisks indicate significantly reduced root hair length and density compared with wild type controls according to a Student's t test (*, P < 0.05; **, P < 0.01; n > 300).
Fig 8
Fig 8. The galt single and double mutants demonstrate reduced inhibition of pollen tube growth in response to β-Gal Yariv reagent.
(A) Representative images of pollen tubes from wild type, galt2, galt5, and galt2 galt5 mutants after 16 h in pollen germination medium, and (B) in pollen germination medium supplemented with 30 μM β-Gal Yariv and (C) in pollen germination medium supplemented with 30 μM α-Gal Yariv reagent. Bar = 30 μm. (D) Pollen tube lengths (from wild type, galt2, galt5, and galt2 galt5 plants) were measured over time in the pollen germination medium (E) in pollen germination medium supplemented with 30 μM α-Gal Yariv reagent and (F) in pollen germination medium supplemented with 30 μM β-Gal Yariv reagent. Twenty flowers from each genotype and 25 pollen tubes from each flower were measured using Image J. The experiment was done in triplicate and the values were subjected to statistical analysis by ANOVA, followed by the Tukey's honestly significant difference test. In response to β-Gal Yariv reagent, WT pollen tubes were significantly shorter than pollen tubes from single mutants (P <0.05) and galt2 galt5 double mutants (P <0.01).
Fig 9
Fig 9. Reduced inhibition of primary root growth of galt2, galt5 and galt2 galt5 mutants in the presence of β-Gal Yariv reagent.
(A) Root lengths of WT, galt2, galt5, and galt2 galt5 plants were measured 7, 14 and 21 d after germination and seedling establishment for 5 d on MS plates, on MS plates supplemented with 50 μM α-Gal Yariv reagent, and on MS plates supplemented with 50 μM β-Gal Yariv reagent. Statistical differences were determined by one way ANOVA, followed by the Tukey's honestly significant difference test. Asterisks represent the statistical significance between genotypes (*, P < 0.05; **, P < 0.01; ***, P <0.001) within a treatment group. Vertical bars represent mean ± SE of the experimental means from at least three independent experiments (n = 5), where experimental means were obtained from 10 to 15 seedlings per experiment. (B) Representative images of WT, galt2, galt5, and galt2 galt5 plants after 14 d of growth on MS plates supplemented with 50 μM β-Gal Yariv reagent. (C) Representative images of WT, galt2, galt5, and galt2 galt5 plants after 14 d of growth on MS plates supplemented with 50 μM α-Gal Yariv reagent. Size bar = 1 cm.
Fig 10
Fig 10. Salt induced inhibition of primary root elongation in galt2, galt5 and galt2 galt5 mutants.
Five-day-old wild-type, galt2, galt5 and galt2 galt5 seedlings germinated on MS medium were transferred onto media containing (A) 100 mM NaCl or (B) 150 mM NaCl and grown vertically. Root elongation (i.e., increase in length after transfer) was measured after 7, 14 and 21 d of growth. Data are the means ± SE of measurements from five independent experiments (total n = 100). Statistical differences were determined by one way ANOVA, followed by the Tukey's honestly significant difference test (*, P <0.05 and **, P <0.01).
Fig 11
Fig 11. Root-Bending assay of wild type, galt, sos5, and fei mutant seedlings.
Five-day-old seedlings grown on MS plates were transferred to MS plates with 100 mM NaCl and reoriented at an angle of 180° (upside down). The photographs were taken 3 d (A), 5 d (B) and 10 d (C and D) after seedling transfer. Bar = 10 mm. (E) Analysis of root curvature in WT, galt, fei1, fei2 and sos5 mutant plants. Statistical differences were determined by one way ANOVA and ‘a’ denotes a significant difference of root curvature (P<0.05) between WT and single galt mutants, ‘b’ denotes a significant difference of root curvature (P<0.01) between galt single mutants and galt2 galt5, fei1fei2, sos5 and fei1fei2sos5 mutants, and ‘c’ denotes a significant difference of root curvature (P<0.001) between WT and galt2 galt5, fei1fei2, sos5 and fei1fei2sos5 mutants. Vertical bars represent mean ± SE of the experimental means from at least two independent experiments (n = 5), where experimental means were obtained from 15 seedlings per experiment.
Fig 12
Fig 12. Conditional root anisotropic growth defects of galt, sos5, and fei mutants.
Light microscopic images of root tips of plant seedlings from indicated genotypes grown for 10d in MS plates with 100 mM NaCl. Seeds were germinated in MS plates and grown for 3d before transferring to the MS plates with 100 mM NaCl. Bar = 1mm.
Fig 13
Fig 13. Staining of seed coat mucilage for cellulose and pectin in wild type, galt, sos5, and fei mutant seeds.
Seeds of the indicated genotypes were prehydrated with water and stained with Calcofluor white and ruthenium red to visualize cellulose and pectin with a Zeiss LSM 510 META laser scanning confocal microscope.
Fig 14
Fig 14. Sites of action of known glycosyltransferases acting on AGPs are depicted within a representative AGP glycomodule sequence found within an AGP molecule.
This glycomodule structure is based on information presented by Tryfona et al. [81]. Additional details on each of the known glycosyltransferases are listed in S1 Table.

Similar articles

Cited by

References

    1. Carpita NC, Gibeaut DM (1993) Structural models of primary cell walls in flowering plants: consistency of molecular structure with the physical properties of the walls during growth. Plant J. 3: 1–30. - PubMed
    1. Albersheim P, Darvill A, Roberts K, Sederoff R, Staehelin A (2011) Plant Cell Walls. (New York: Garland Science, Taylor & Francis Group; ).
    1. Albenne C, Canut H, Jamet E (2013) Plant cell wall proteomics: the leadership of Arabidopsis thaliana. Frontiers in Plant Science 4: 111 10.3389/fpls.2013.00111 - DOI - PMC - PubMed
    1. Showalter AM (1993) Structure and function of plant cell wall proteins. Plant Cell 5: 9–23. - PMC - PubMed
    1. Hijazi M, Velasquez SM, Jamet E, Estevez JM, Albenne C (2014) An update on post-translational modifications of hydroxyproline-rich glycoproteins: toward a model highlighting their contribution to plant cell wall architecture. Front Plant Sci. 5:395 10.3389/fpls.2014.00395 - DOI - PMC - PubMed

Publication types

MeSH terms