Review
. 2015 Aug;98(2):135-44.
doi: 10.1002/cpt.148. Epub 2015 Jun 25.

Emerging Targets for Therapeutic Development in Diabetes and Its Complications: The RAGE Signaling Pathway

Affiliations
Review

Emerging Targets for Therapeutic Development in Diabetes and Its Complications: The RAGE Signaling Pathway

Ems Litwinoff et al. Clin Pharmacol Ther. 2015 Aug.

Abstract

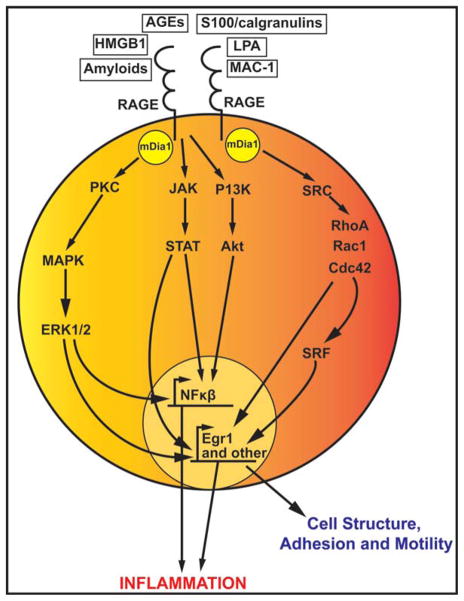
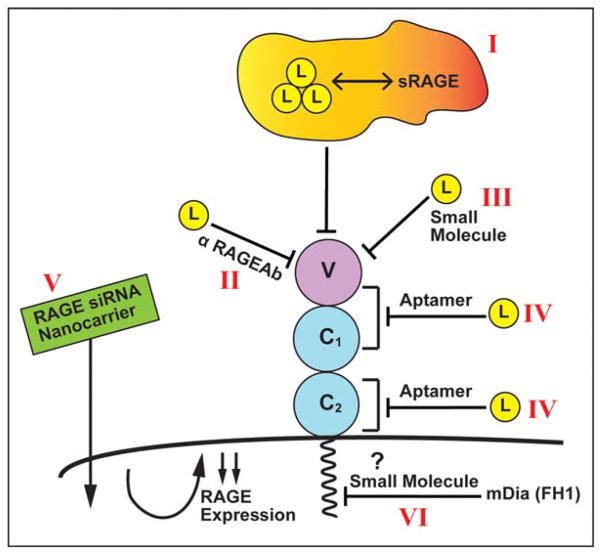
Types 1 and 2 diabetes are on the rise worldwide. Although the treatment of hyperglycemia has benefited from recent advances, aggressive efforts to maintain euglycemia may be fraught with risk, especially in older subjects or in subjects vulnerable to hypoglycemic unawareness. Hence, strategies to prevent and treat the complications of hyperglycemia are essential. In this review we summarize recent updates on the biology of the receptor for advanced glycation endproducts (RAGE) in the pathogenesis of both micro- and macrovascular complications of diabetes, insights from the study of mouse models of obesity and diabetic complications, and from associative studies in human subjects. The study of the mechanisms and consequences of the interaction of the RAGE cytoplasmic domain with the formin, mDia1, in RAGE signal transduction, will be discussed. Lastly, we review the "state-of-the-art" on RAGE-directed therapeutics. Tackling RAGE/mDia1 may identify a novel class of therapeutics preventing diabetes and its complications.


Conflict of interest statement

CONFLICT OF INTEREST

The authors report no conflicts of interest.

Figures

Figure 1
Figure 1
Overview of RAGE signaling pathways. RAGE ligands induce a variety of signaling cascades, which lead to upregulation of inflammation and cellular mechanics. The PI3K/Akt and the Src/RhoA pathways may signal through mDia1 to increase NFκB and Egr-1 induced transcription. Downstream signaling of RAGE also includes the JAK/STAT and MAPK/Erk pathways, which also lead to upregulation of NFκB and Egr-1 and other transcriptional mechanisms. NFκB transcribed genes upregulate inflammation, and Egr-1 transcribed genes are involved in cell structure, motility, and adhesion and in tissue injury.
Figure 2
Figure 2
Deletion of Ager in OVE26 mice imparts partial protection from the structural abnormalities of diabetic nephropathy (DN) at age 7 months. (a) No histologic abnormalities were detected in FVB RKO mice (not shown). By contrast, OVE26 mice display well developed features of diabetic nephropathy including diffuse and global mesangial sclerosis and focal hyaline casts (b). OVE26 RKO mice are markedly protected from the development of mesangial sclerosis and tubular cast formation (c). There were significant differences between OVE26 mice and OVE26 RKO mice with respect to percent cortical area occupied by casts (d) and the severity of mesangial sclerosis (e), where 0 =no mesangial sclerosis; 1 =mild; 2 =moderate; 3 =severe (*P <0.05). Original magnifications are marked above each image. Semiquantitative scoring (d,e) was performed on n =7 OVE26 RKO and n =13 OVE26 mice. (Note: RKO =mice devoid of Ager). Republished from Reiniger, N., et al. Diabetes 59, 2043–2054 (2010).
Figure 3
Figure 3
Deletion of Ager suppresses diabetes-accelerated atherosclerosis and effect of diabetes and Ager deficiency on atherosclerotic lesion content. (a) Male Apoe null (n =8) and Apoe null/Ager null mice (n =7) were rendered diabetic with streptozotocin at age 6 weeks. Mice were sacrificed at age 14 weeks and aortas were retrieved. Mean atherosclerotic lesion area at the aortic sinus is reported; statistical considerations are indicated in the text. (b) Immunostaining and picrosirius red staining of atherosclerotic lesions from the indicated Apoe null mice was performed for detection of macrophages, smooth muscle cells, T cells, and collagen (the latter using picrosirius red and polarizing microscopy) at age 24 weeks. Note that the lesions in the non-diabetic or any Ager-deficient mice were quite small at age 14 weeks; hence, detailed lesion characterization was performed at age 24 weeks (after 18 weeks of established hyperglycemia). Lesion areas at the aortic sinus were 6.8 × 10⁵ vs. 0.9 × 105 μm2 in Apoe null diabetic vs. nondiabetic Apoe null mice, respectively; P <0.02. Lesions areas in nondiabetic Apoe null/Ager null mice were 0.5 × 105 μm2; P <0.05 vs. nondiabetic Apoe null mice. Lesion areas in diabetic Apoe null/Ager null mice were 3.8 × 105 μm2; P <0.05 vs. diabetic Apoe null mice. Once we established these relationships at 24 weeks of age, we then proceeded to analyze lesion composition. In all cases, the percent of cell type/lesion area, or %collagen/lesion area, was then calculated using the Zeiss imaging analysis program. n =5 mice/group. Error bars are standard deviations. Statistical considerations are indicated in the figure. In b, each distinct set of bars represents the cell type or collagen content. The four bars in each set represent the genotype and the diabetic state (*P <0.03 vs. Apoe null/Ager null diabetic. **P <0.01 vs. Apoe null/Ager null nondiabetic. ^P <0.02 vs. Apoe null Ager null nondiabetic). Republished from Bu, D.X. et al. Circ. Res. 106, 1040–1051 (2010).
Figure 4
Figure 4
Mice devoid of Ager are resistant to high-fat diet-induced obesity. WT and Ager null male mice were fed low-fat diet or high-fat diet and body mass measured. Time course studies were performed (left panel) and in the right panel the mean body mass at the end of the study is shown. n =7–8 mice per group. *P <0.001 comparing WT vs. Ager null mice fed high-fat diet. Republished from Song, F. et al. Diabetes 63, 1948–1965 (2014).
Figure 5
Figure 5
Strategies for targeting RAGE. Experimental evidence from animal models as well as associative evidence in human studies provides strong support for the role of this pathway in the pathogenesis of diabetes and its complications. Indeed, a number of therapeutic strategies targeting RAGE and its signaling pathways are in active therapeutic development. Examples of such strategies are shown in this figure, including sRAGE, the extracellular ligand binding domain of RAGE that sequesters RAGE ligands and blocks their activation of cell surface receptors (I); anti-RAGE antibodies (II); small molecules that block the binding of RAGE ligands to the receptor (III); RAGE peptide aptamers that block ligand binding to the various domains of RAGE (IV); nanocarriers delivering siRNAs to knockdown RAGE expression (V); and small molecules (or other forms of agents) that block the binding of the RAGE tail to the FH1 domain of mDia1 (VI).

References

    1. WHO. [Accessed 9 February 2015];Obesity and Overweight. 2015 < http://www.who.int/mediacentre/factsheets/fs311/en/>.
    1. CDC. [Accessed 9 February 2015];Adult Obesity Facts. 2014 < http://www.cdc.gov/obesity/data/adult.html>.
    1. CDC. National Diabetes Statistics Report. 2014 < http://www.cdc.gov/diabetes/pubs/statsreport14/national-diabetes-report-...>.
    1. Alberti KG, Zimmet PZ. Definition, diagnosis and classification of diabetes mellitus and its complications. Part 1: Diagnosis and classification of diabetes mellitus provisional report of a WHO consultation. Diabetic Med. 1998;15:539–553. - PubMed
    1. Gaens KH, Stehouwer CD, Schalkwijk CG. Advanced glycation endproducts and its receptor for advanced glycation endproducts in obesity. Curr Opin Lipidol. 2013;24:4–11. - PubMed

Publication types

MeSH terms