. 2016 Apr;10(2):280-8.
doi: 10.1109/TBCAS.2015.2405480. Epub 2015 May 12.

A Wearable Patch to Enable Long-Term Monitoring of Environmental, Activity and Hemodynamics Variables

A Wearable Patch to Enable Long-Term Monitoring of Environmental, Activity and Hemodynamics Variables

Mozziyar Etemadi et al. IEEE Trans Biomed Circuits Syst. 2016 Apr.

Abstract

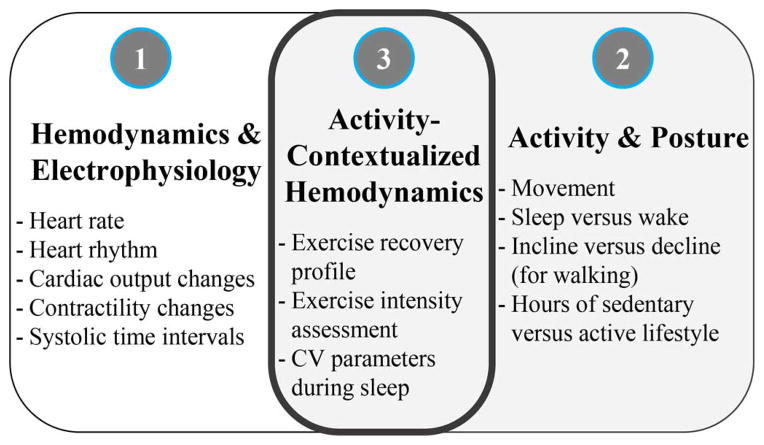
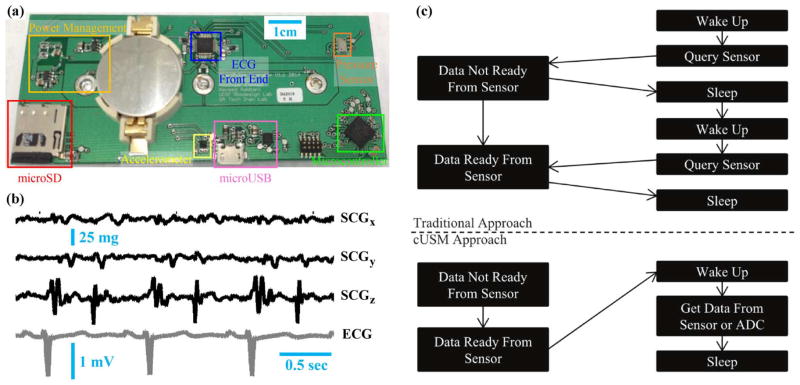
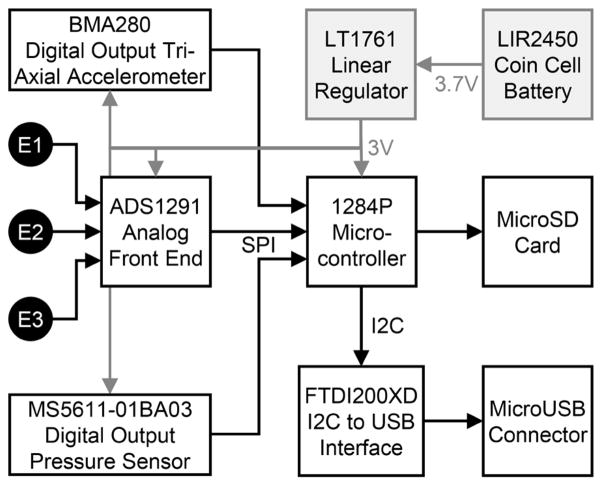
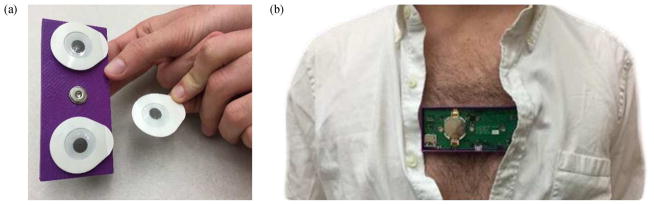
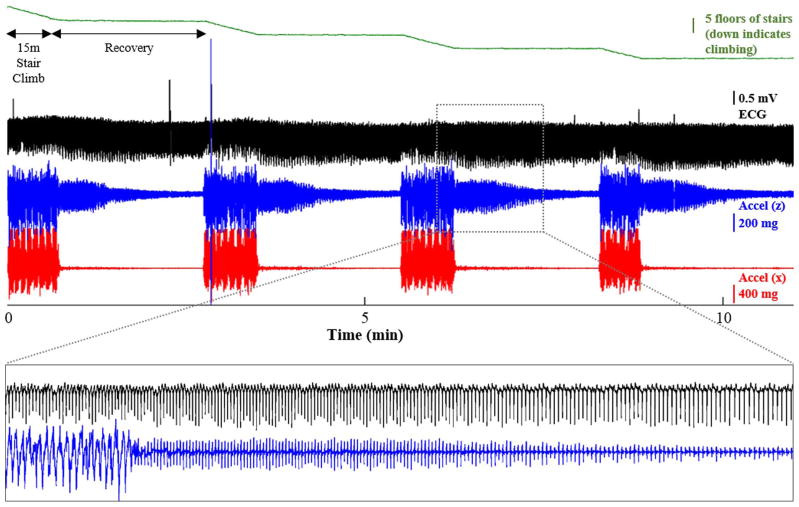
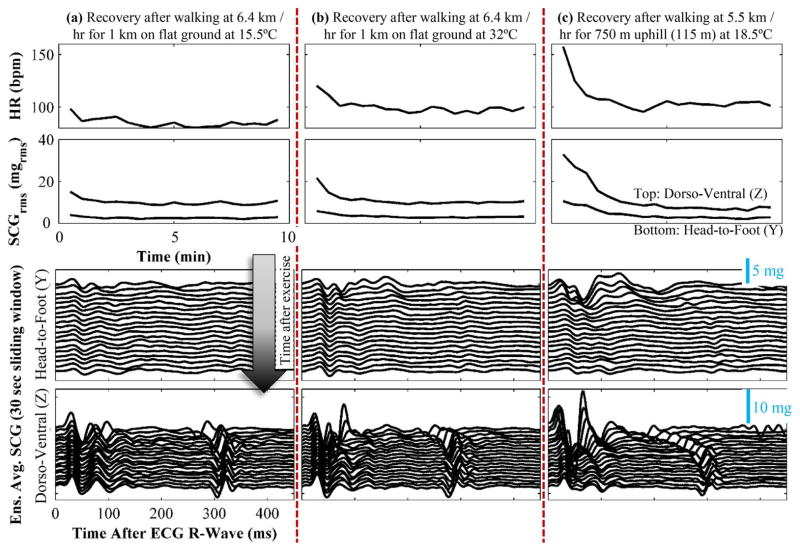
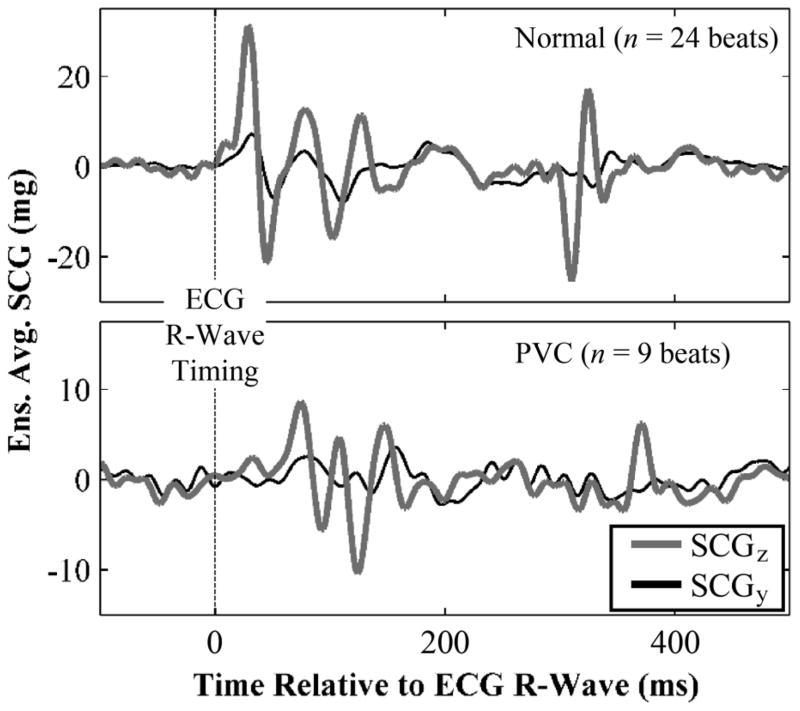
We present a low power multi-modal patch designed for measuring activity, altitude (based on high-resolution barometric pressure), a single-lead electrocardiogram, and a tri-axial seismocardiogram (SCG). Enabled by a novel embedded systems design methodology, this patch offers a powerful means of monitoring the physiology for both patients with chronic cardiovascular diseases, and the general population interested in personal health and fitness measures. Specifically, to the best of our knowledge, this patch represents the first demonstration of combined activity, environmental context, and hemodynamics monitoring, all on the same hardware, capable of operating for longer than 48 hours at a time with continuous recording. The three-channels of SCG and one-lead ECG are all sampled at 500 Hz with high signal-to-noise ratio, the pressure sensor is sampled at 10 Hz, and all signals are stored to a microSD card with an average current consumption of less than 2 mA from a 3.7 V coin cell (LIR2450) battery. In addition to electronic characterization, proof-of-concept exercise recovery studies were performed with this patch, suggesting the ability to discriminate between hemodynamic and electrophysiology response to light, moderate, and heavy exercise.


Figures

Fig. 1
Fig. 1
Overview of key cardiovascular (1), activity/posture (2), and activity-contextualized hemodynamics (3) parameters that can be measured by the sensing suite described in this paper. These parameters can be useful for home monitoring of patients with chronic cardiovascular diseases or conditions (such as heart failure), as well as for the general population to assess personal health and fitness more accurately.
Fig. 2
Fig. 2
(a) Photo of wearable patch hardware; this circuit includes snaps for interfacing to three Ag/AgCl gel electrodes attached to the skin. (b) Raw (unfiltered) ECG and three-axis low pass filtered (fc = 40 Hz) SCG signals from one subject with the device attached to the sternum. (c) cUSM’s cyclic executive operating system. In contrast to traditional approaches where timing is determined by the microcontroller, the sensor (or sensor ADC) determines the timing of the cUSM system. Writing to microSD, which is an infrequent event, is identical in both cases and is not shown.
Fig. 3
Fig. 3
Block diagram of sensors and electronic components on wearable patch. The microUSB was used for debugging purposes only. E1, E2, and E3 represent the three electrodes used for mounting the sensor on the body; SPI refers to serial peripheral interface; I2C is the inter-integrated circuit protocol; MicroSD is a micro secure digital card.
Fig. 4
Fig. 4
(a) Placing surface ECG electrodes (Ag/AgCl) on the wearable patch snaps. (b) Photo showing device worn on the chest.
Fig. 5
Fig. 5
All signals (from top to bottom, pressure-based height, ECG, SCGz, SCGx) measured from a healthy subject performing several successive stair climbing exercises. After climbing each set of stairs, the subject stands still for two minutes to recover; during that period, the SCG signal RMS power recovers to the baseline value. The height of the stairs that were climbed, z, was derived from the pressure sensor output, P, using the barometric formula: z = −RT/Mg * ln(P/Po), where R is the universal gas constant, T is ambient temperature, M is the molar mass of Earth’s air, g is the acceleration due to gravity, and is the baseline pressure (prior to the altitude change). The duration of the inset is 2 minutes.
Fig. 6
Fig. 6
Physiological response for one subject performing three different activities described above. (a) Walking at a moderate pace in comfortable temperature with no incline produced a small increase in HR, SCG RMS power, and decrease in left ventricular ejection time (LVET) as estimated from the SCGz (to the first order as a reduction in the time delay between the first and second complex of the SCG signal). (b) Walking at a moderate pace in warm temperature with no incline produced a much greater increase in HR, SCG RMS power, and decrease in LVET; additionally, due to the warm ambient temperature, the cardiovascular response was elevated throughout the recording (even after full recovery), demonstrated by the increased resting RMS power in the SCGy [compared to (a)] and increased resting HR. (c) Walking at a moderate pace uphill in comfortable temperature produced the largest increase in HR, SCG RMS power, and decrease in LVET; there was also a noticeable decrease in the pre-ejection period (PEP) as seen in the SCGz [(to the first order as a reduction in the time delay between the ECG R-wave (t = 0 in the plots above) to the first main complex of the SCG ensemble average].
Fig. 7
Fig. 7
Ensemble averaged SCG waveforms in the dorso-ventral (z) and head-to-foot (y) direction for normal (top) and PVC (bottom) heartbeats. Note the difference in y-axis scale for the normal and PVC beats. The time delay between the ECG R-wave and the first peak (MC) of the SCG is lengthened for the PVC beats, as is expected due to compromised contractility of the ventricle (reduced dP/dt). Interestingly, the y-direction SCG ensemble average morphology was affected more by the PVC than the z-direction, suggesting potential differences in physiological genesis for the two directions.

References

    1. Salerno DM, Zanetti J. Seismocardiography for monitoring changes in left ventricular function during ischemia. CHEST J. 1991;100:991–993. - PubMed
    1. Tavakolian K. PhD dissertation. Applied Science: School of Engineering Science, Simon Fraser Univ; Burnaby, BC, Canada: 2010. Characterization and analysis of seismocardiogram for estimation of hemodynamic parameters.
    1. Castiglioni P, Faini A, Parati G, Di Rienzo M. Wearable seismocardiography. Proc. 29th Annu. Int. Conf. IEEE Engineering in Medicine and Biology Society; 2007; pp. 3954–3957. - PubMed
    1. Inan OT, Migeotte PF, Park K-S, Etemadi M, Tavakolian K, Casanella R, et al. Ballistocardiography and seismocardiography: A review of recent advances. IEEE J Biomed Health Inform. to be published. - PubMed
    1. Crow RS, Hannan P, Jacobs D, Hedquist L, Salerno DM. Relationship between seismocardiogram and echocardiogram for the events in the cardiac cycle. Amer J Noninvas Cardiol. 1994;8:39–46.

Publication types