. 2015 Jul 3;290(27):16824-40.
doi: 10.1074/jbc.M115.660100. Epub 2015 May 13.

Loss of the Mono-ADP-ribosyltransferase, Tiparp, Increases Sensitivity to Dioxin-induced Steatohepatitis and Lethality

Affiliations

Loss of the Mono-ADP-ribosyltransferase, Tiparp, Increases Sensitivity to Dioxin-induced Steatohepatitis and Lethality

Shaimaa Ahmed et al. J Biol Chem. .

Abstract

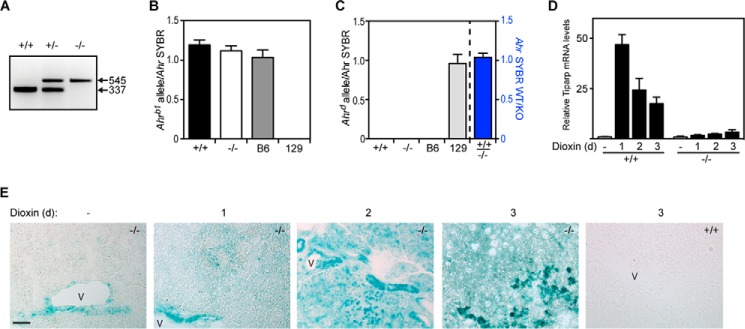
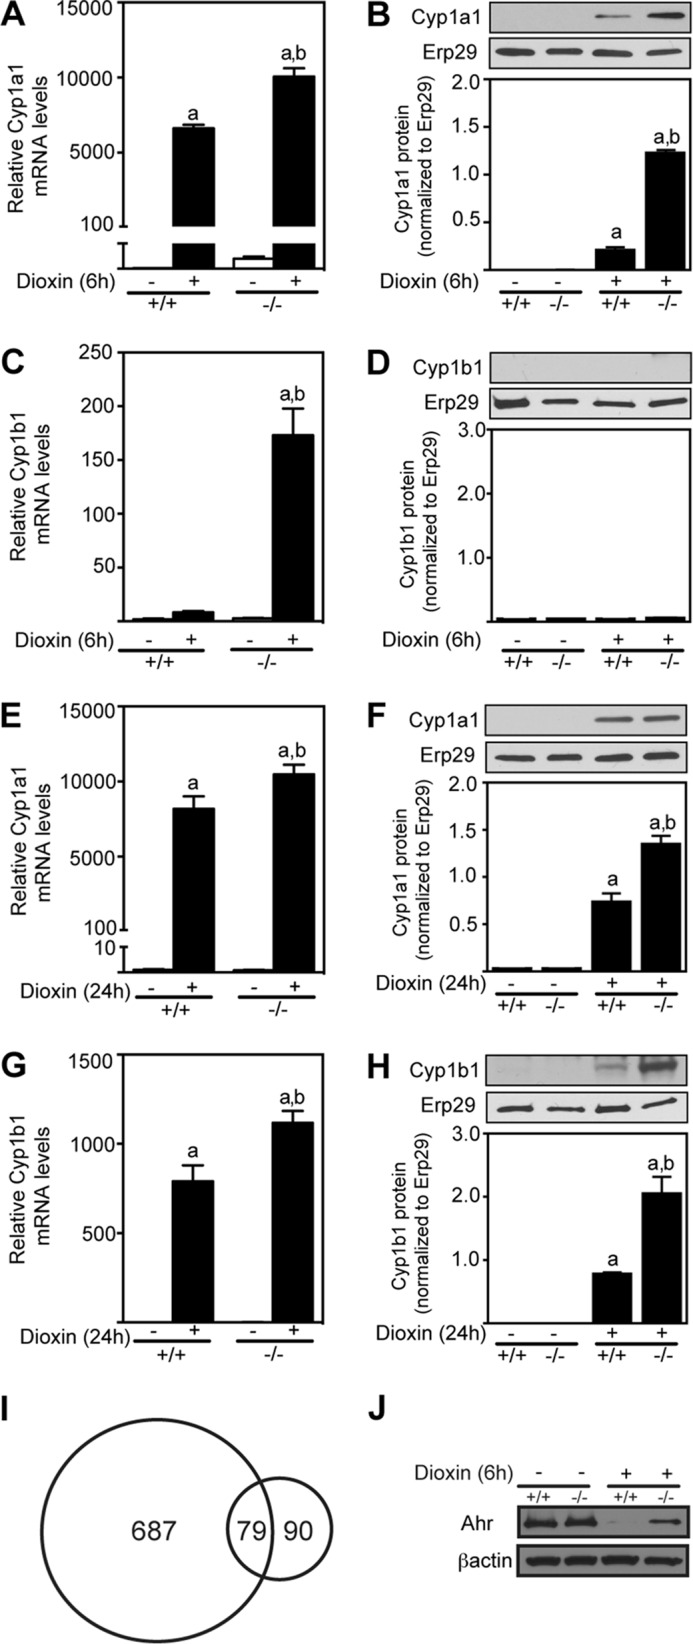
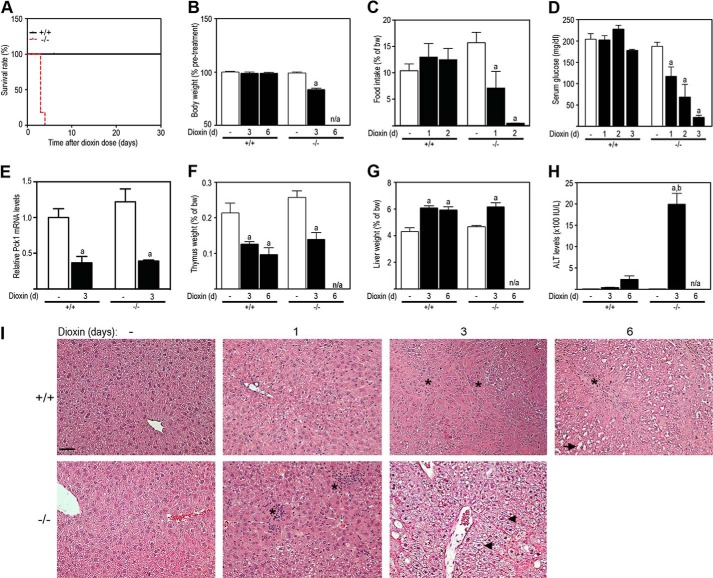
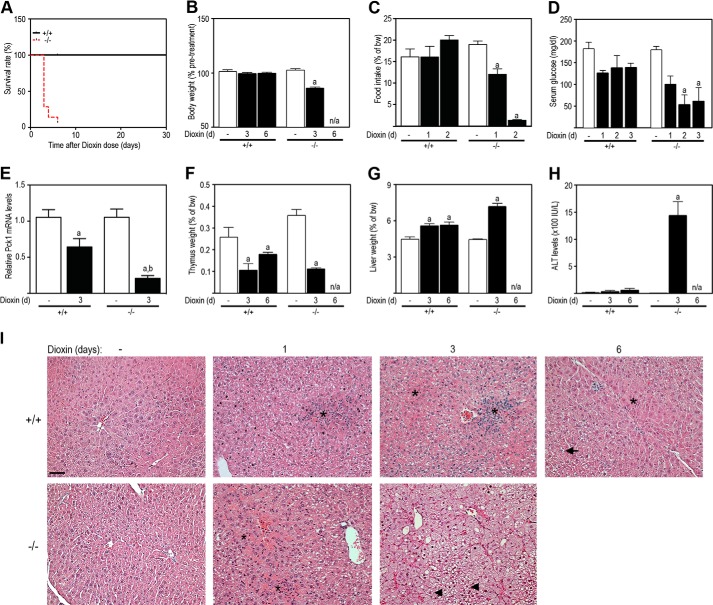
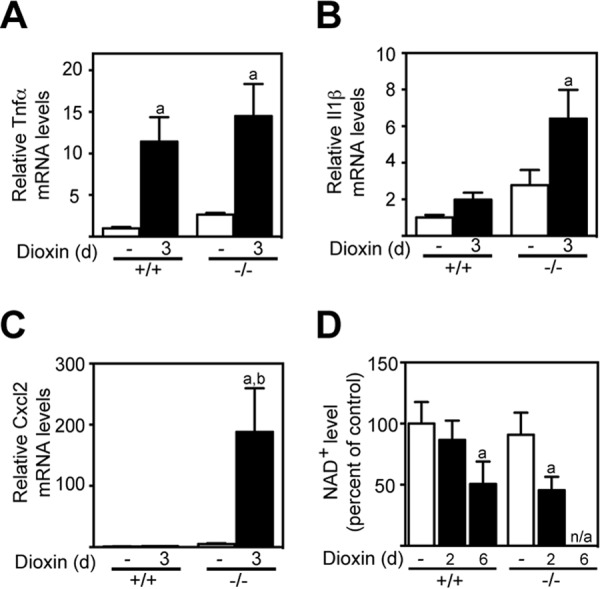
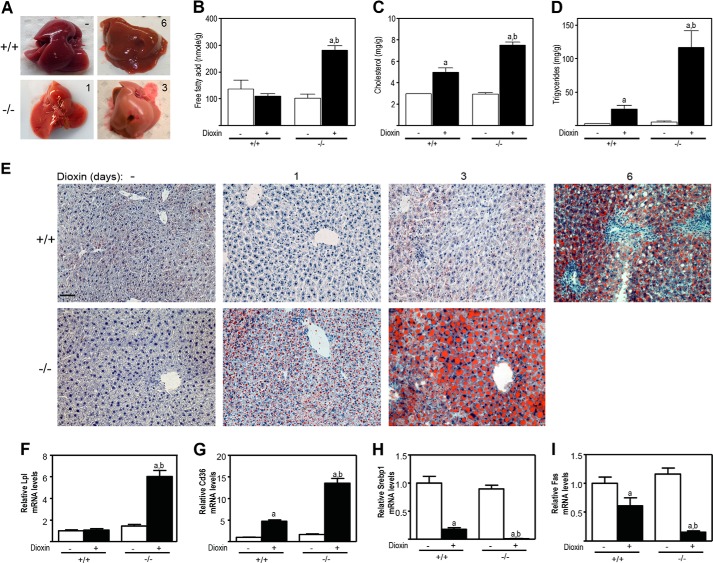
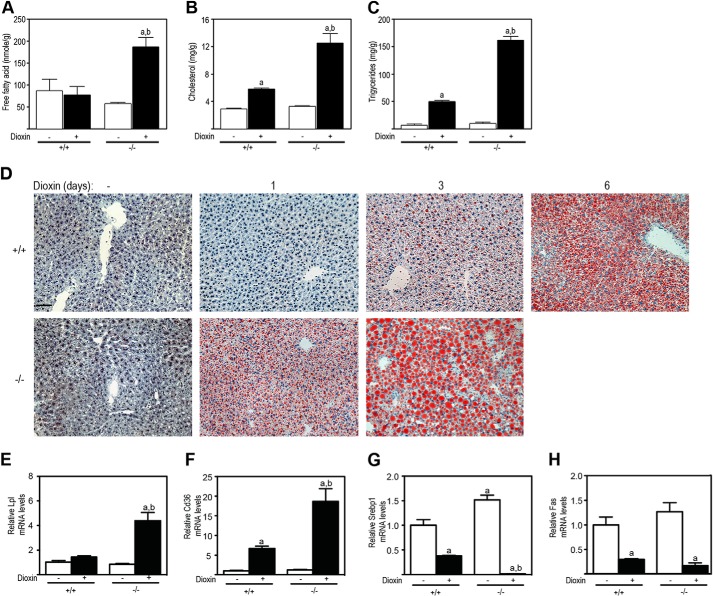
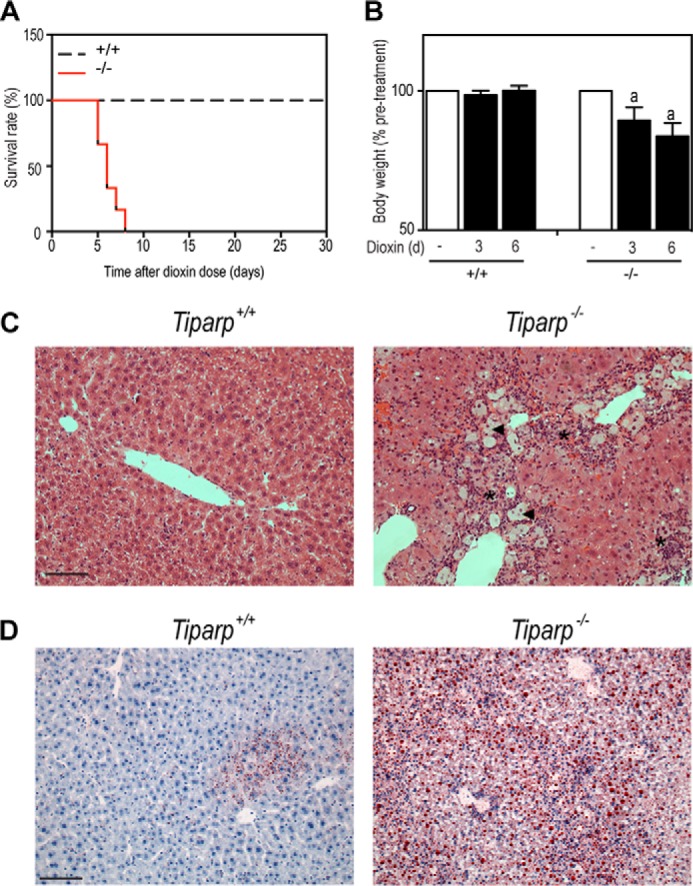
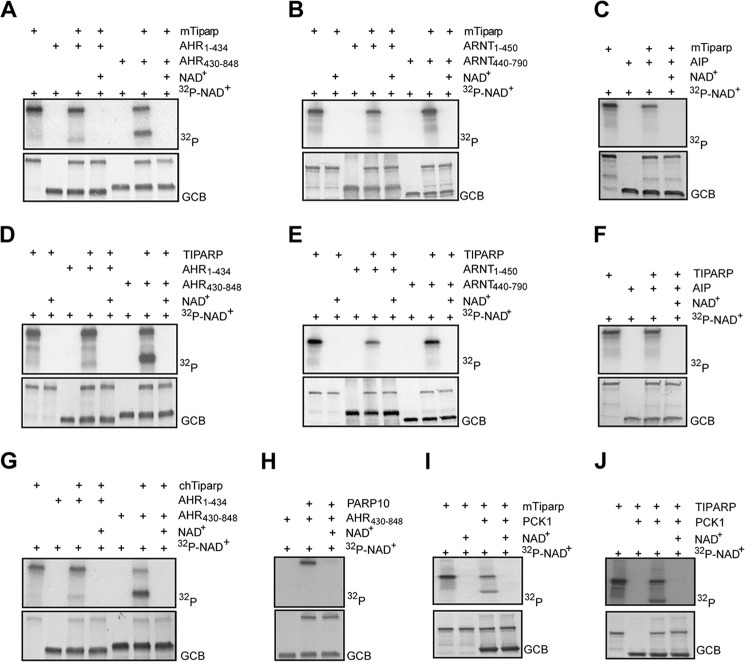
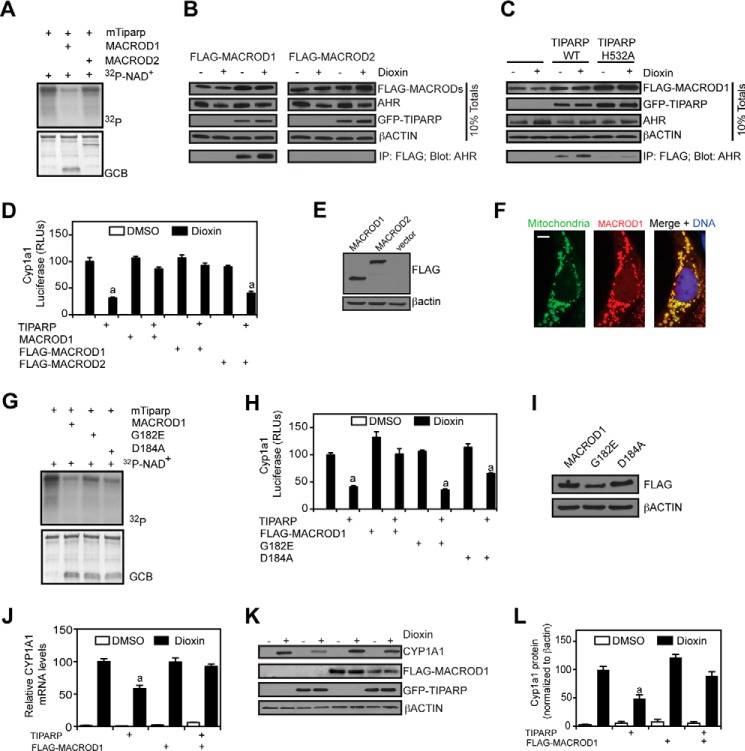
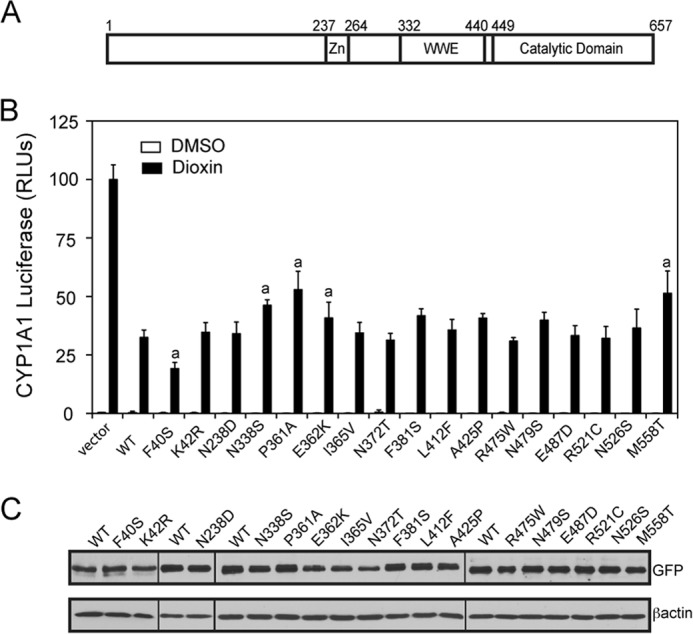
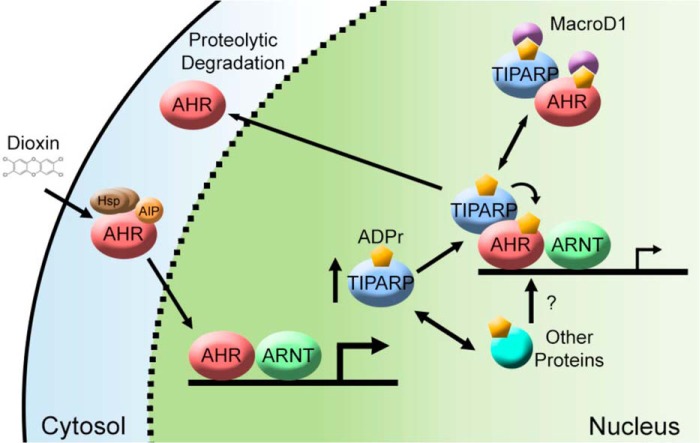
The aryl hydrocarbon receptor (AHR) mediates the toxic effects of the environmental contaminant dioxin (2,3,7,8-tetrachlorodibenzo-p-dioxin; TCDD). Dioxin causes a range of toxic responses, including hepatic damage, steatohepatitis, and a lethal wasting syndrome; however, the mechanisms are still unknown. Here, we show that the loss of TCDD-inducible poly(ADP-ribose) polymerase (Tiparp), an ADP-ribosyltransferase and AHR repressor, increases sensitivity to dioxin-induced toxicity, steatohepatitis, and lethality. Tiparp(-/-) mice given a single injection of 100 μg/kg dioxin did not survive beyond day 5; all Tiparp(+/+) mice survived the 30-day treatment. Dioxin-treated Tiparp(-/-) mice exhibited increased liver steatosis and hepatotoxicity. Tiparp ADP-ribosylated AHR but not its dimerization partner, the AHR nuclear translocator, and the repressive effects of TIPARP on AHR were reversed by the macrodomain containing mono-ADP-ribosylase MACROD1 but not MACROD2. These results reveal previously unidentified roles for Tiparp, MacroD1, and ADP-ribosylation in AHR-mediated steatohepatitis and lethality in response to dioxin.

Keywords: ADP-ribosylation; aryl hydrocarbon receptor (AhR) (AHR); dioxin; gene expression; toxicity.


Figures

FIGURE 1.
FIGURE 1.
Characterization of Tiparp−/− mice. A, PCR genotyping showing bands of 337 and 545 bp indicating the wild type and mutant alleles, respectively. qPCR genotyping of the Ahr gene using an Ahrb1 allele-specific fluorescent probe (B) or Ahrd allele-specific probe (C). qPCR was performed on genomic DNA from n = 15 (Tiparp+/+ (+/+)), n = 18 Tiparp−/− (−/−), n = 4 C57BL/6 (B6), and n = 4 129 mice. The data were analyzed as described under “Experimental Procedures.” D, Dioxin- and time-dependent changes in Tiparp mRNA levels in male Tiparp+/+ (+/+) and Tiparp−/− (−/−) mice treated with DMSO or 100 μg/kg dioxin for 1–3 days (n = 4). E, representative hepatic β-galactosidase staining in mice euthanized 1–3 days after treatment. β-Galactosidase expression increased with time and was present throughout the liver with the highest levels seen in cells surrounding blood vessels (v). Control sections were from Tiparp+/+ livers treated with dioxin for 3 days. Scale bar represents 50 μm, and all images are to the same scale.
FIGURE 2.
FIGURE 2.
Dioxin-induced hepatic Cyp1a1 and Cyp1b1 mRNA and protein expression levels are increased in Tiparp−/− mice. Male Tiparp+/+ (+/+) and Tiparp−/− (−/−) mice were treated with either corn oil (−) or 30 μg/kg dioxin (+) for 6 h (A–D) or 24 h (E–H). The Cyp1a1 (A and E) and Cyp1b1 (C and G) mRNA levels are shown relative to time-matched control (no dioxin (−))-treated Tiparp+/+ (+/+) samples. Data represent the mean ± S.E. (n = 4). Representative Cyp1a1 (B and F), Cyp1b1 (D and H), and Erp29 microsomal protein levels were detected by Western blotting after 6 and 24 h. Cyp1a1 and Cyp1b1 proteins levels were normalized to Erp29 levels. Data are representative of three animals per treatment group. I, overlap of differentially regulated dioxin-induced hepatic genes in Tiparp+/+ and Tiparp−/− mice treated for 6 h. J, hepatic Ahr and β-actin protein levels were detected by Western blotting after 6 h of dioxin treatment. Data are representative of 3–4 animals per treatment group. a, p < 0.05 two-way ANOVA compared with control Tiparp+/+ mice; b, p < 0.05 two-way ANOVA compared with dioxin-treated Tiparp+/+ mice.
FIGURE 3.
FIGURE 3.
Loss of Tiparp increases dioxin-induced hepatotoxicity and lethal wasting syndrome in male mice. A, Kaplan-Meier survival curves for male Tiparp+/+ and Tiparp−/− mice treated with a single 100 μg/kg intraperitoneal injection of dioxin and monitored for 30 days. B, body weight; C, food intake; D, serum glucose levels; and E, hepatic Pck1 mRNA levels after dioxin treatment. Thymus (F) and liver weight (G) expressed as percentage of total body weight were measured from Tiparp+/+ and Tiparp−/− mice. H, serum alanine aminotransferase (ALT) activity was determined 3 and 6 days after treatment. Data shown are the mean ± S.E. n = 4–5 (A–E and H); n = 6 (F and G). a, p < 0.05, ANOVA followed by Tukey's post hoc test compared with genotype-matched control-treated mice. (H) b indicates p < 0.05, ANOVA followed by Tukey's post hoc test compared with day 6-treated Tiparp+/+ mice. I, representative H&E staining of livers (n = 3). Control (no dioxin (−)) animals were injected with DMSO and were euthanized on day 3. The asterisks indicate focal inflammatory infiltration; the arrowheads indicate microvesicular steatosis, and the arrow indicates cytoplasmic clearing. Scale bar represents 50 μm, and all images are to the same scale.
FIGURE 4.
FIGURE 4.
Loss of Tiparp increases dioxin-induced hepatotoxicity and lethal wasting syndrome in female mice. A, Kaplan-Meier survival curves for Tiparp+/+ and Tiparp−/− mice. Female mice were treated with a single 100 μg/kg intraperitoneal injection of dioxin and monitored for up to 30 days. B, Tiparp−/− mice exhibit increased weight loss (% body weight relative to pretreatment). C, food intake of Tiparp+/+ and Tiparp−/− mice after dioxin treatment. Serum glucose levels were determined with a commercially available kit (D), and hepatic Pck1 mRNA levels were determined as described under “Experimental Procedures” (E). Thymus (F) and liver (G) weights expressed as percentage of total body weight were measured from Tiparp+/+ and Tiparp−/− mice. Serum alanine-aminotransferase (ALT) activity was determined after 3 and 6 days of treatment (H). Data shown are the mean ± S.E. n = 4–5 (A–E and H); n = 6 (F and G). a, p < 0.05, ANOVA followed by Tukey's post hoc test compared with genotype-matched control treated mice. E, b indicates p < 0.05, ANOVA followed by Tukey's post hoc test compared with day 3 dioxin-treated Tiparp+/+ mice. Mice were given a single injection of 100 μg/kg dioxin and euthanized after 1, 3, or 6 days (n = 3) (I). The control (no dioxin (−)) animals received a single injection of DMSO and were euthanized after 3 days. Liver sections were stained with H&E. The asterisks indicate focal inflammatory infiltration; the arrowheads indicate microvesicular steatosis 3 days post-injection (−/−), and the arrow indicates cytoplasmic clearing 6 days post-injection (+/+). Each image is representative of at least three animals. Scale bar represents 50 μm, and all images are to the same scale.
FIGURE 5.
FIGURE 5.
Dioxin increases hepatic cytokine levels and decreases NAD+ levels in Tiparp+/+ and Tiparp−/− mice. Hepatic Tnfα (A), Il1β (B), and Cxcl2 (C) mRNA levels were determined as described under “Experimental Procedures.” D, hepatic NAD+ levels in dioxin-treated Tiparp+/+ and Tiparp−/− mice. Data represent the mean ± S.E. (n = 4). a, p < 0.05 one-way ANOVA compared with control-treated Tiparp+/+. b, p < 0.05 one-way ANOVA compared with dioxin-treated Tiparp+/+.
FIGURE 6.
FIGURE 6.
Dioxin-induced steatosis is increased in male Tiparp−/− mice. A, livers from male Tiparp+/+ mice given a single intraperitoneal injection of DMSO or 100 μg/kg dioxin and euthanized after 6 days. Similarly treated Tiparp−/− mice were euthanized after 1 or 3 days (n = 4). Intrahepatic free fatty acids (B), cholesterol (C), and triglycerides (D) from Tiparp+/+ and Tiparp−/− mice 3 days after dioxin treatment. Data represent the mean ± S.E. (n = 3). E, Oil-Red-O and hematoxylin-stained liver sections from Tiparp+/+ and Tiparp−/− mice. The control (no dioxin (−)) liver sections are from DMSO-treated mice euthanized 3 days (−/−) and 6 days (+/+) post-injection. The scale bar represents 50 μm, and all images are to the same scale. Hepatic mRNA levels of Lpl (F), Cd36 (G), Srebp1 (H), and Fas (I) were determined as described under “Experimental Procedures.” Data represent the mean ± S.E. (n = 4). For all data, p < 0.05 was determined by ANOVA followed by Tukey's post hoc test comparison. Significantly different compared with DMSO- (a) or dioxin-treated (b) Tiparp+/+ mice.
FIGURE 7.
FIGURE 7.
Dioxin-induced steatosis is increased in female Tiparp−/− mice. Intrahepatic free fatty acids (A), cholesterol (B), and triglycerides (C) from Tiparp+/+ and Tiparp−/− mice after 3 days of treatment were determined with commercially available kits. Data represent the mean ± S.E. (n = 3). D, Oil-Red-O and hematoxylin-stained liver sections from Tiparp+/+ and Tiparp−/− mice treated with DMSO or 100 μg/kg dioxin and euthanized after 1, 3, or 6 days. Dioxin-treated livers had an accumulation of fat (stained red) after 1 day (−/−) or 3 days (+/+). The control (no dioxin (−)) liver sections are representative of livers from DMSO-treated mice euthanized 3 (−/−) and 6 days (+/+) post-injection. The scale bar represents 50 μm, and all images are to the same scale. E–H, hepatic lipid transport and lipogenic gene expression of 3-day dioxin-treated Tiparp+/+ and Tiparp−/− mice. Hepatic mRNA levels of Lpl (E), Cd36 (F), Srebp1 (G), and Fas (H) were determined as described under “Experimental Procedures.” Data represent the mean ± S.E. (n = 4). For all data, p < 0.05 was determined by ANOVA followed by Tukey's post hoc test comparison. Significantly different compared with DMSO-treated (a) or dioxin-treated (b) Tiparp+/+ mice.
FIGURE 8.
FIGURE 8.
Single intraperitoneal injection of 10 μg/kg bw is lethal to Tiparp−/− mice. A, Kaplan-Meier survival curves for male Tiparp+/+ and Tiparp−/− mice treated with a single 10 μg/kg intraperitoneal injection of dioxin and monitored for 30 days. B, body weight at indicated days after dioxin treatment. C, representative H&E staining of livers (n = 4) from Tiparp+/+ and Tiparp−/− mice on day 5 after receiving a single injection 10 μg/kg dioxin. The asterisks indicate focal inflammatory infiltration, the arrowheads indicate microvesicular steatosis, and the arrow indicates cytoplasmic clearing. D, Oil-Red-O and hematoxylin-stained liver sections from Tiparp+/+ and Tiparp−/− mice 5 days after receiving a single injection of 10 μg/kg dioxin. The scale bar represents 50 μm, and all images are to the same scale. B, p < 0.05 was determined by ANOVA followed by Tukey's post hoc test comparison. Significantly different compared with same day matched (a) dioxin-treated Tiparp+/+ mice.
FIGURE 9.
FIGURE 9.
Tiparp selectively mono-ADP-ribosylates AHR. GST-murine Tiparp (mTiparp) was incubated with GST-AHR(1–434) or GST-AHR(430–848) (A), GST-ARNT(1–450) or GST-ARNT (440–789) (B), and GST-AIP in the presence of 32P-NAD+ (C) under the conditions shown. GST-TIPARP (human) was incubated with GST-AHR(1–434) or GST-AHR(430–848) (D), GST-ARNT(1–450) or GST-ARNT (440–789) (E), and GST-AIP in the presence of 32P-NAD+ (F) under the conditions shown. GST-chicken Tiparp (chTiparp) was incubated with GST-AHR(1–434) or GST-AHR(430–848) (G), GST-PARP10 was incubated GST-AHR(430–848) (H), and GST-mTiparp (I) or GST-TIPARP (J) was incubated with His-PCK1 (I) in the presence of 32P-NAD+ under the conditions shown. Prior to autoradiography, PVDF membranes were stained with Gel Code Blue (GCB) to visualize the proteins to ensure equal loading. The data shown are representative of three independent experiments.
FIGURE 10.
FIGURE 10.
TIPARP and MacroD1 regulate AHR activity through reversible mono-ADP-ribosylation. A, MacroD1 more effectively removes mono-ADP-ribose from modified GST-mTiparp compared with MacroD2. B, MACROD1 but not MACROD2 forms a complex with AHR that is dependent on TIPARP. C, interactions between MACROD1 and AHR were reduced in the presence of the TIPARP catalytic mutant (H532A) compared with TIPARP (WT). D, MACROD1 but not MacroD2 prevents TIPARP-dependent repression of AHR regulated reporter gene activity in transiently transfected HuH7 cells, n = 4. E, Western blots of FLAG-MACROD1 and FLAG-MACRoD2 in HuH7 cells. F, subcellular localization of MACROD1. MACROD1 was located predominantly in the mitochondria, but it was also found in the cytoplasm and nucleus. HuH7 cells were transfected with pcDNA-MACROD1, fixed, immunostained for MACROD1, and mounted using Vectashield containing DAPI to visualize DNA. G, two point mutants in MACROD1 prevent its ability to effectively remove mono-ADP-ribose from TIPARP. H, expression of MACROD1G182E or MACROD1D184A in HuH7 cells does not prevent TIPARP-dependent repression of AHR-regulated reporter gene activity, n = 4. I, Western blots of FLAG-MACROD1 (WT), FLAG-MACROD1G182E, and FLAG-MACROD1D184A mutants in transfected HuH7 cells. A–C, E–G, and I, data are representative of three independent experiments. A and G, PVDF membranes were stained with GelCode Blue (GCB) prior to autoradiography to visualize the proteins to ensure equal loading. J, dioxin-induced CYP1A1 mRNA levels were determined in extracts from HuH7 cells transfected with GFP-TIPARP and/or FLAG-MACROD1. K, Western blots of CYP1A1, GFP-TIPARP, and FLAG-MACROD1 in extracts isolated from transfected HuH7 cells. L, quantification of CYP1A1 proteins levels using ImageJ, n = 3. a, significant differences (p < 0.05) compared with dioxin in the absence of TIPARP or macrodomain proteins as determined by ANOVA of the mean followed by Tukey's post hoc test.
FIGURE 11.
FIGURE 11.
SNPs in human TIPARP differentially affect its ability to repress AHR-dependent CYP1A1-regulated reporter gene activity. A, schematic of TIPARP with its known domains. Zn, zinc finger; WWE, tryptophan-tryptophan-glutamate. The numbers above the domains refer to amino acid positions. B, effect of overexpression of GFP-TIPARP and various SNPs in HuH7 on the TIPARP-dependent repression of AHR-regulated reporter gene activity. C, Western blots of GFP-TIPARP and various SNPs and βACTIN in extracts isolated from transfected HuH7 cells. The data are representative of three independent experiments. a, significant differences (p < 0.05) compared with dioxin in the presence of WT TIPARP. RLU, relative light unit.
FIGURE 12.
FIGURE 12.
Schematic representation of TIPARP, MACROD1, and mono-ADP-ribosylation in AHR signaling. Dioxin binds and activates AHR resulting in its nuclear translocation, heterodimerization with ARNT, and increase in TIPARP expression levels. TIPARP catalyzes the mono-ADP-ribosylation of AHR and/or other target proteins causing reduced AHR activity and increased AHR proteolytic degradation (25). MACROD1 binds and hydrolyzes ADP-ribose reversing the actions of TIPARP. The actions of TIPARP and MACROD1 regulate the AHR activity with the loss of TIPARP leading to increased AHR activity and dioxin-induced toxicity.

References

    1. Nebert D. W., Puga A., Vasiliou V. (1993) Role of the Ah receptor and the dioxin-inducible [Ah] gene battery in toxicity, cancer, and signal transduction. Ann. N.Y. Acad. Sci. 685, 624–640 - PubMed
    1. Denis M., Cuthill S., Wikström A. C., Poellinger L., Gustafsson J. A. (1988) Association of the dioxin receptor with the Mr 90,000 heat shock protein: a structural kinship with the glucocorticoid receptor. Biochem. Biophys. Res. Commun. 155, 801–807 - PubMed
    1. Perdew G. H. (1988) Association of the Ah receptor with the 90-kDa heat shock protein. J. Biol. Chem. 263, 13802–13805 - PubMed
    1. Carver L. A., Bradfield C. A. (1997) Ligand-dependent interaction of the aryl hydrocarbon receptor with a novel immunophilin homolog in vivo. J. Biol. Chem. 272, 11452–11456 - PubMed
    1. Hahn M. E., Allan L. L., Sherr D. H. (2009) Regulation of constitutive and inducible AHR signaling: complex interactions involving the AHR repressor. Biochem. Pharmacol. 77, 485–497 - PMC - PubMed

Publication types

Substances