. 2015 May 15:5:9976.
doi: 10.1038/srep09976.

Prediction of prostate cancer recurrence using quantitative phase imaging

Affiliations

Prediction of prostate cancer recurrence using quantitative phase imaging

Shamira Sridharan et al. Sci Rep. .

Abstract

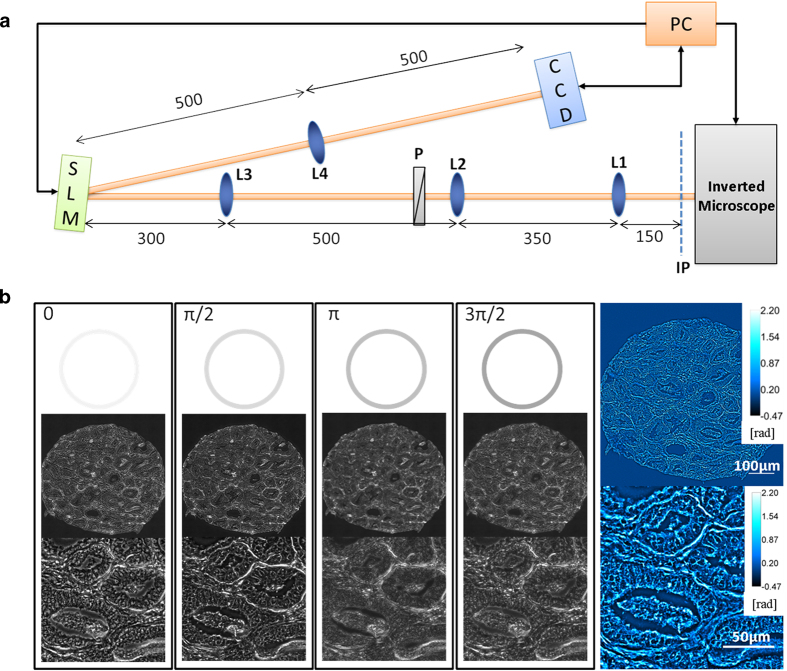
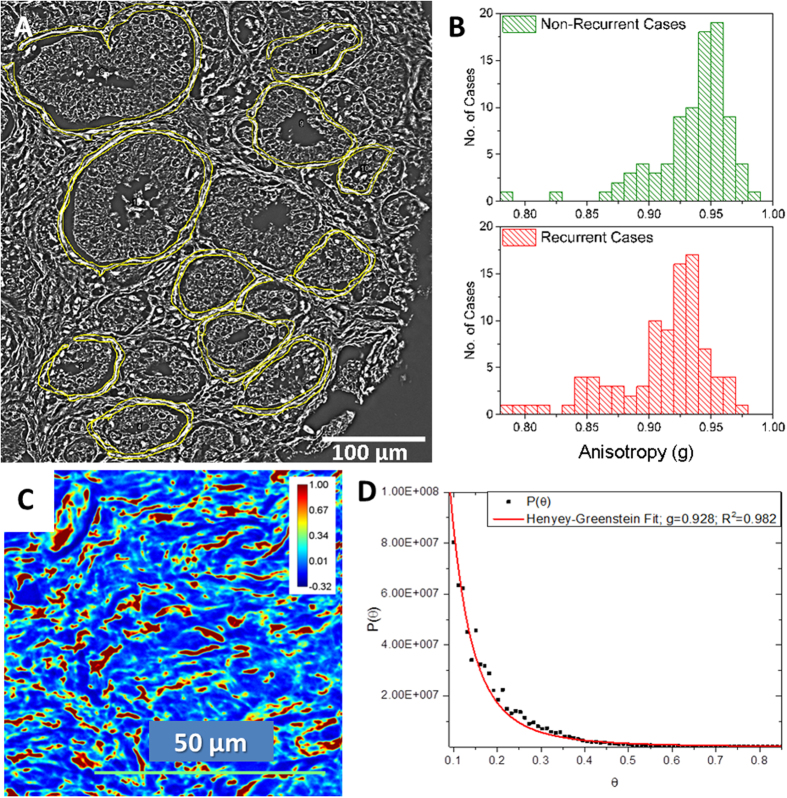
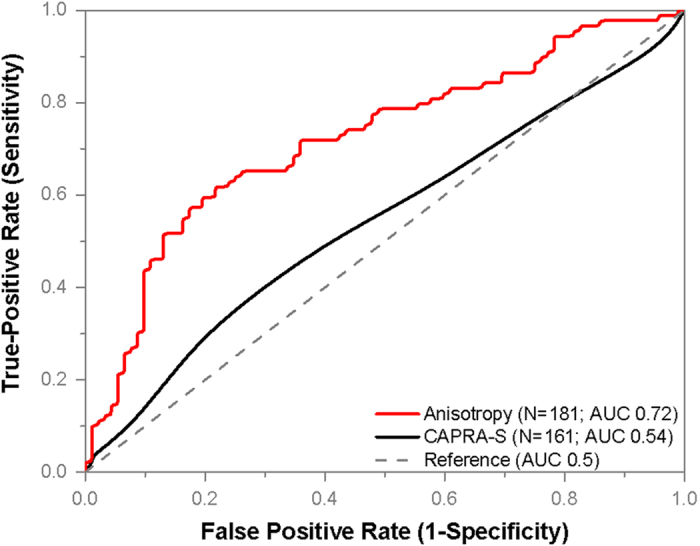
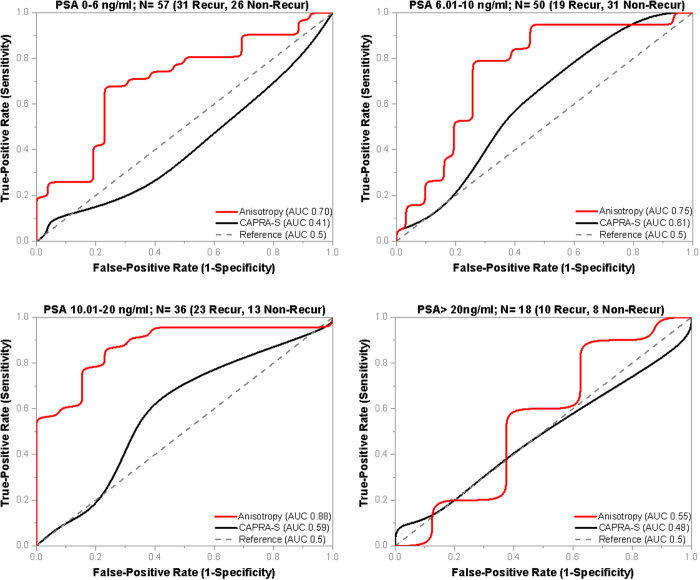
The risk of biochemical recurrence of prostate cancer among individuals who undergo radical prostatectomy for treatment is around 25%. Current clinical methods often fail at successfully predicting recurrence among patients at intermediate risk for recurrence. We used a label-free method, spatial light interference microscopy, to perform localized measurements of light scattering in prostatectomy tissue microarrays. We show, for the first time to our knowledge, that anisotropy of light scattering in the stroma immediately adjoining cancerous glands can be used to identify patients at higher risk for recurrence. The data show that lower value of anisotropy corresponds to a higher risk for recurrence, meaning that the stroma adjoining the glands of recurrent patients is more fractionated than in non-recurrent patients. Our method outperformed the widely accepted clinical tool CAPRA-S in the cases we interrogated irrespective of Gleason grade, prostate-specific antigen (PSA) levels and pathological tumor-node-metastasis (pTNM) stage. These results suggest that QPI shows promise in assisting pathologists to improve prediction of prostate cancer recurrence.


Figures

Figure 1
Figure 1. The imaging system.
(A) The SLIM set-up is an add-on module to a commercial phase contrast microscope. The first set of lenses (L1 and L2) magnify the image to maintain the resolution of the microscope. The Fourier transform of the image plane is projected by lens L3 onto the spatial light modulator (SLM) where the phase pattern is shifted in phase 4 times, in increments of π/2. The lens L4 Fourier transforms the pattern on the SLM and the final image is recorded onto the CCD and stored on the computer. (B) Four phase shifted images recorded using a 40X/0.75NA objective with the final quantitative phase image shown on the right. Color bars indicate phase values in radians.
Figure 2
Figure 2. Mosaic SLIM imaging of an unstained tissue microarray.
(A) Unstained tissue microarray slide. (B) The mosaic is set up around the core of interest. (C) The recording at each tile proceeds as shown by the arrow. For each 1388 × 1040 pixel SLIM tile, four intensity images are recorded. The phase images are then stitched together using an ImageJ plugin built in our lab.
Figure 3
Figure 3. Comparison of H&E and SLIM images.
(A,B) H&E and SLIM images corresponding to a patient who had biochemical recurrence of prostate cancer after undergoing radical prostatectomy. (C,D) H&E and SLIM images corresponding to the matched twin who did not have cancer recurrence. Both patients had Gleason score 7 (3 + 4) prostate cancer of pT2b stage without seminal vesicle invasion, no extra-prostatic extensions and surgical margins were free of cancer. The H&E images themselves do not provide any information about recurrence.
Figure 4
Figure 4. Optical Anisotropy Calculation.
(A) Optical anisotropy (g) was calculated in the single layer of stroma immediately adjoining multiple glands in each core. (B) The histograms show the distribution of anisotropy values among the 89 non-recurrent and 92 recurrent cases. The bin-size on the histogram was set at 0.01. (C) SLIM image of a stromal tissue region in the prostate imaged using the 40X/0.75NA objective. Optical anisotropy value calculated using the scattering phase theorem in this tissue region was g = 0.932. (D) Anisotropy calculation using Henyey-Greenstein phase function fit of the scattering angular distribution yields g = 0.928.
Figure 5
Figure 5. Results for Prostate Cancer Recurrence using Anisotropy of Scattering.
Single layers of stroma immediately adjoining 12–16 glands were isolated in SLIM images from each of the 92 recurrent and 89 non-recurrent patients who underwent prostatectomy. The patients in the two groups were matched based on age at prostatectomy, Gleason grade and clinical stage. The optical anisotropy parameter was calculated for each region, as described in Materials and Methods. This parameter separates cases of recurrence from non-recurrent twins with an AUC of 0.72, as shown. Lower values of this index correspond to a greater probability of biochemical recurrence. By using a cut-off value of g = 0.938, we can predict recurrence with a sensitivity of 77% and specificity of 62%. CAPRA-S scores corresponding to 161 patients, 83 recurrent and 78 non-recurrent, showed poor discrimination (AUC 0.54). Twenty cases were excluded in CAPRA-S analysis due to one or more missing parameters for CAPRA-S calculation.
Figure 6
Figure 6. Influence of PSA on Anisotropy Values.
Optical anisotropy (g), has poor correlation with pre-surgical PSA levels which prompted the prostate cancer diagnosis (Pearson r = −0.12). The performance of anisotropy and CAPRA-S is compared across various PSA ranges. (A) At PSA 0–6 ng/ml, anisotropy (AUC 0.7) outperforms CAPRA-S (AUC 0.41), which failed on the 57 cases. (B) At PSA 6.01–10 ng/ml, CAPRA-S has the best results (AUC 0.61), but anisotropy (AUC 0.75) still shows better discrimination. (C) At PSA 10.01–20 ng/ml, anisotropy (0.88) has the best performance among all the PSA ranges and performs better than CAPRA-S (0.59). (D) At PSA > 20 ng/ml, both anisotropy (AUC 0.55) and CAPRA-S (AUC 0.48) show poor discrimination.

References

    1. Howlader N., et al. SEER Cancer Statistics Review, 1975–2011. National Cancer Institute, Bethesda, MD, 2014).
    1. Wilt T. J., et al. Radical Prostatectomy versus Observation for Localized Prostate Cancer. New Engl. J. Med. 367, 203–213 (2012). - PMC - PubMed
    1. Eggener S. E., et al. Predicting 15-year prostate cancer specific mortality after radical prostatectomy. J. Urol. 185, 869–875 (2011). - PMC - PubMed
    1. Stephenson A. J., et al. Prostate cancer-specific mortality after radical prostatectomy for patients treated in the prostate-specific antigen era. J. Clin. Oncol. 27, 4300–4305 (2009). - PMC - PubMed
    1. Hull G.W., et al. Cancer control with radical prostatectomy alone in 1,000 consecutive patients. J. Urol. 167, 528–534 (2002). - PubMed

Publication types

Substances