. 2015 Nov;93(10):885-95.
doi: 10.1038/icb.2015.57. Epub 2015 May 15.

BCR repertoire sequencing: different patterns of B-cell activation after two Meningococcal vaccines

Affiliations

BCR repertoire sequencing: different patterns of B-cell activation after two Meningococcal vaccines

Jacob D Galson et al. Immunol Cell Biol. 2015 Nov.

Abstract

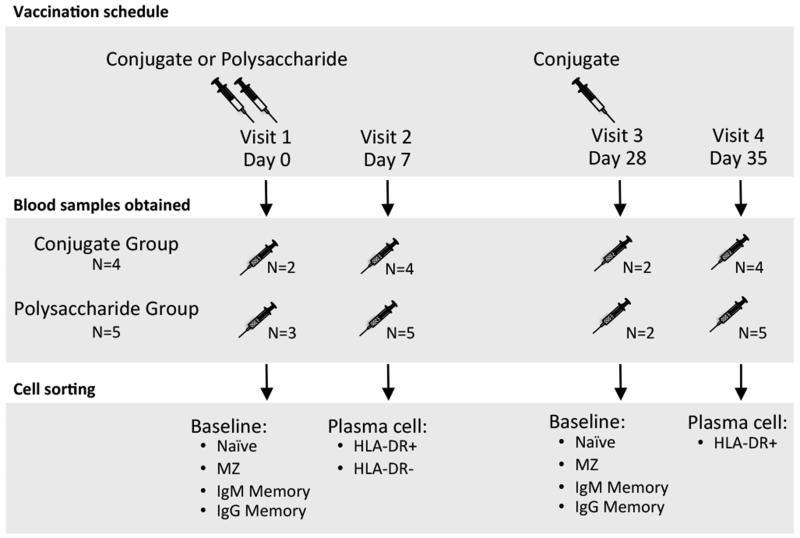
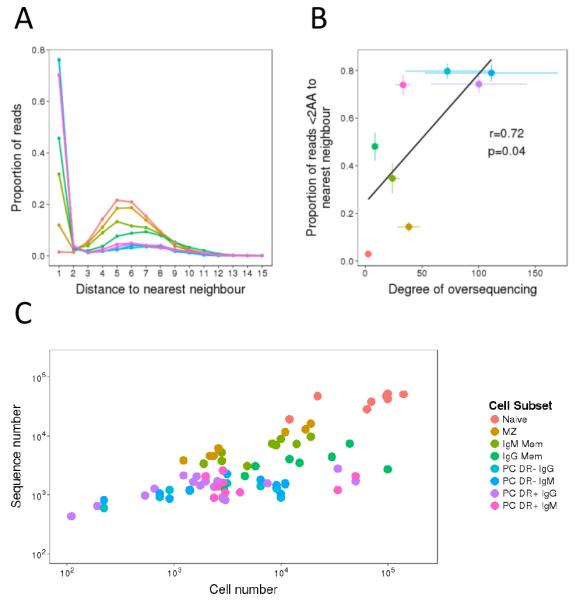
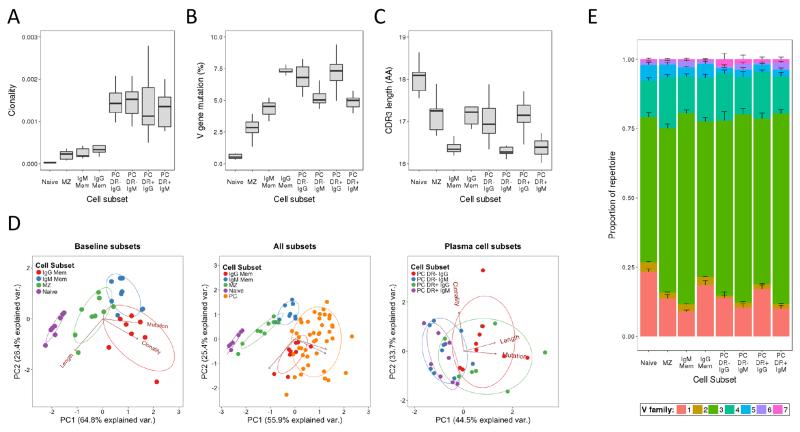
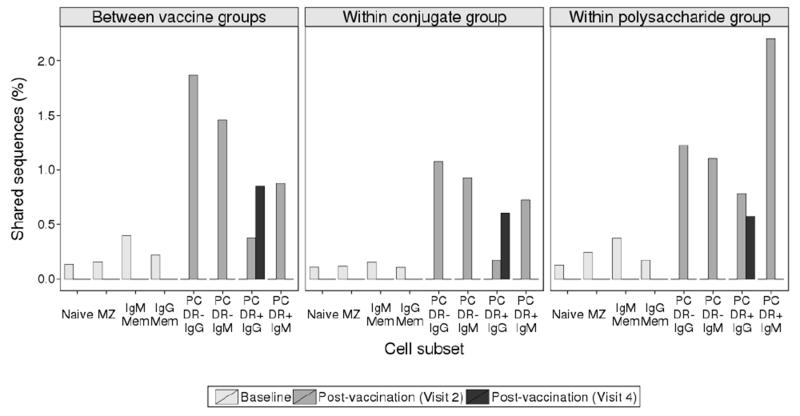
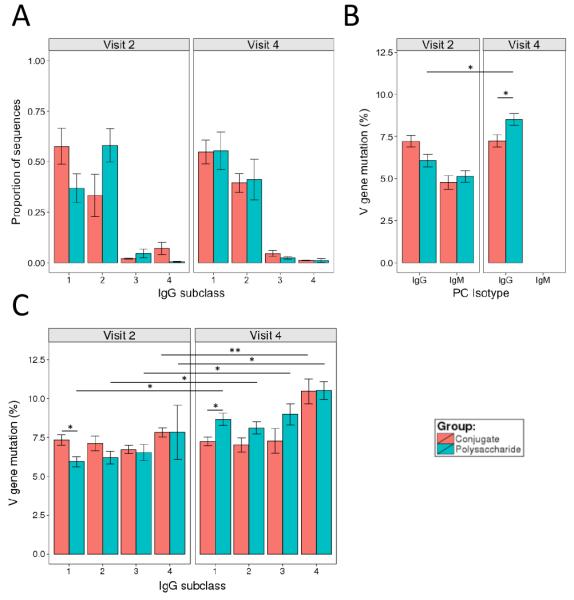
Next-generation sequencing was used to investigate the B-cell receptor heavy chain transcript repertoire of different B-cell subsets (naive, marginal zone (MZ), immunoglobulin M (IgM) memory and IgG memory) at baseline, and of plasma cells (PCs) 7 days following administration of serogroup ACWY meningococcal polysaccharide and protein-polysaccharide conjugate vaccines. Baseline B-cell subsets could be distinguished from each other using a small number of repertoire properties (clonality, mutation from germline and complementarity-determining region 3 (CDR3) length) that were conserved between individuals. However, analyzing the CDR3 amino-acid sequence (which is particularly important for antigen binding) of the baseline subsets showed few sequences shared between individuals. In contrast, day 7 PCs demonstrated nearly 10-fold greater sequence sharing between individuals than the baseline subsets, consistent with the PCs being induced by the vaccine antigen and sharing specificity for a more limited range of epitopes. By annotating PC sequences based on IgG subclass usage and mutation, and also comparing them with the sequences of the baseline cell subsets, we were able to identify different signatures after the polysaccharide and conjugate vaccines. PCs produced after conjugate vaccination were predominantly IgG1, and most related to IgG memory cells. In contrast, after polysaccharide vaccination, the PCs were predominantly IgG2, less mutated and were equally likely to be related to MZ, IgM memory or IgG memory cells. High-throughput B-cell repertoire sequencing thus provides a unique insight into patterns of B-cell activation not possible from more conventional measures of immunogenicity.


Figures

Fig. 1
Fig. 1
Study plan and sampling protocol. Four participants were given a conjugate, and five participants given a polysaccharide MenACWY vaccine at day 0. All participants were given the conjugate vaccine at day 28. All participants had blood taken 7 days after each vaccine for PC repertoire analysis. Each participant also had blood taken on either the day of the first vaccine or the day of the second vaccine (but not both) for repertoire analysis of baseline B cell subsets. Fluorescence-activated cell sorting was used to isolated the different B cell subsets at each visit.
Fig. 2
Fig. 2
Validation of clustering parameters. A) Distribution of reads with different CDR3 AA distances to their closest neighbor. Calculated separately for each participant, and mean values plotted for each cell subset. B) Correlation between degree of over-sequencing (number of sequences / number of cells) and the proportion of reads with a distance of 2 or fewer AA differences to their closest neighbor, calculated for each cell subset. Error bars indicate ± SEM. Regression line, and correlation coefficient with corresponding p value are shown. C) Correlation between cell number for a particular sample, and the number of sequences (after clustering) for that sample.
Fig. 3
Fig. 3
Repertoire differences in the different cell subsets. Differences in A) clonality, B) V gene mutation and C) CDR3 AA length between the different cell subsets. For A,B and C, boxes show locations of 25, 50 and 75th percentiles. Whiskers show data within 1.5× the interquartile range. Samples from all participants and timepoints were included together in the analysis. D) Principal component analysis including just the baseline cell subsets, just the plasma cell subsets, or all cell subsets together, utilizing the clonality, V gene mutation, and CDR3 length variables. E) Proportion of sequences utilizing different V gene families in the different cell subsets. Error bars indicate ± SEM.
Fig. 4
Fig. 4
Percent of CDR3 AA sequences shared either within or between the two vaccine groups in the different subsets on the different days. Within vaccine group shared sequences are shared between at least two participants. Percent shared between A and B = (A∩B/sum(A,B)*100).
Fig. 5
Fig. 5
Relationships between baseline subsets and PCs produced after vaccination. A) Circos diagrams from one representative participant in the conjugate group, and one representative participant in the polysaccharide group showing the relationship between baseline subsets, and HLA-DR+ IgM and IgG PCs after the first vaccination. Colored sections represent baseline subsets, and black section represents PCs after vaccination. The length of each section represents the number of different sequences comprising that subset. Sequences are ordered clockwise by abundance, which is represented by the grey histogram. Colored lines join sequences that are present in the PCs, and any one of the baseline subsets. Sequences shared within the different baseline subsets are not shown. B) Probability of shared PC sequences at visit 2 being shared with each baseline cell subset for HLA-DR+ IgG and IgM PCs after the first vaccine (either conjugate or polysaccharide depending on vaccine group). C) Same as B, but with HLA-DR+ PCs at visit 4 after the second vaccine (conjugate for both vaccine groups). Error bars indicate ± SEM. For sequences to be defined as shared they had to have an exact CDR3 AA sequence match, and use the same V and J genes.
Fig. 6
Fig. 6
IgG usage and mutation in HLA-DR+ PC sequences after vaccination in the two study groups. A) Proportion of sequences of each IgG subclass after the first and second vaccines. B) Percent of mutated nucleotides in the V gene after the first and second vaccines for IgM and IgG PCs. C) Same as B, but split by IgG subclass. Error bars indicate ± SEM. Comparisons performed using the t test. *p<0.05, **p<0.005.

Similar articles

Cited by

References

    1. Galson JD, Pollard AJ, Trück J, Kelly DF. Studying the antibody repertoire after vaccination: practical applications. Trends Immunol. 2014;35:319–331. - PubMed
    1. Jiang N, He J, Weinstein JA, Penland L, Sasaki S, He X-S, et al. Lineage structure of the human antibody repertoire in response to influenza vaccination. Sci Transl Med. 2013;5:171ra19. - PMC - PubMed
    1. Vollmers C, Sit R, Weinstein JA, Dekker CL, Quake SR. Genetic measurement of memory B-cell recall using antibody repertoire sequencing. Proc Natl Acad Sci USA. 2013;110:13463–8. - PMC - PubMed
    1. Ademokun A, Wu Y-C, Martin V, Mitra R, Sack U, Baxendale H, et al. Vaccination-induced changes in human B-cell repertoire and pneumococcal IgM and IgA antibody at different ages. Aging Cell. 2011;10:922–30. - PMC - PubMed
    1. Laserson U, Vigneault F, Gadala-Maria D, Yaari G, Uduman M, Vander Heiden JA, et al. High-resolution antibody dynamics of vaccine-induced immune responses. Proc Natl Acad Sci U S A. 2014;111:4928–33. - PMC - PubMed

Publication types

MeSH terms