. 2015 Aug 7:1616:157-165.
doi: 10.1016/j.brainres.2015.05.005. Epub 2015 May 11.

Positive regulation of neocortical synapse formation by the Plexin-D1 receptor

Affiliations

Positive regulation of neocortical synapse formation by the Plexin-D1 receptor

F Wang et al. Brain Res. .

Abstract

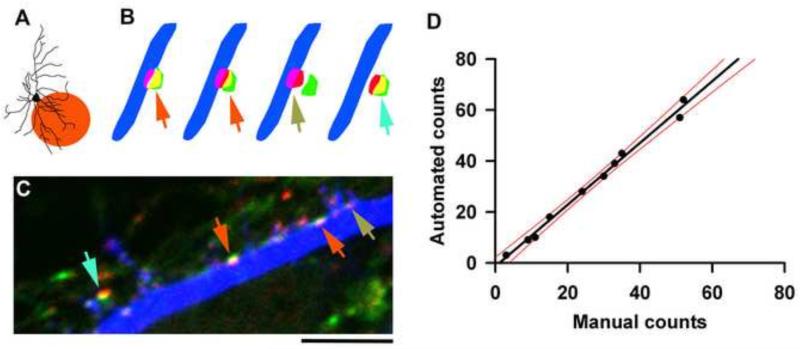
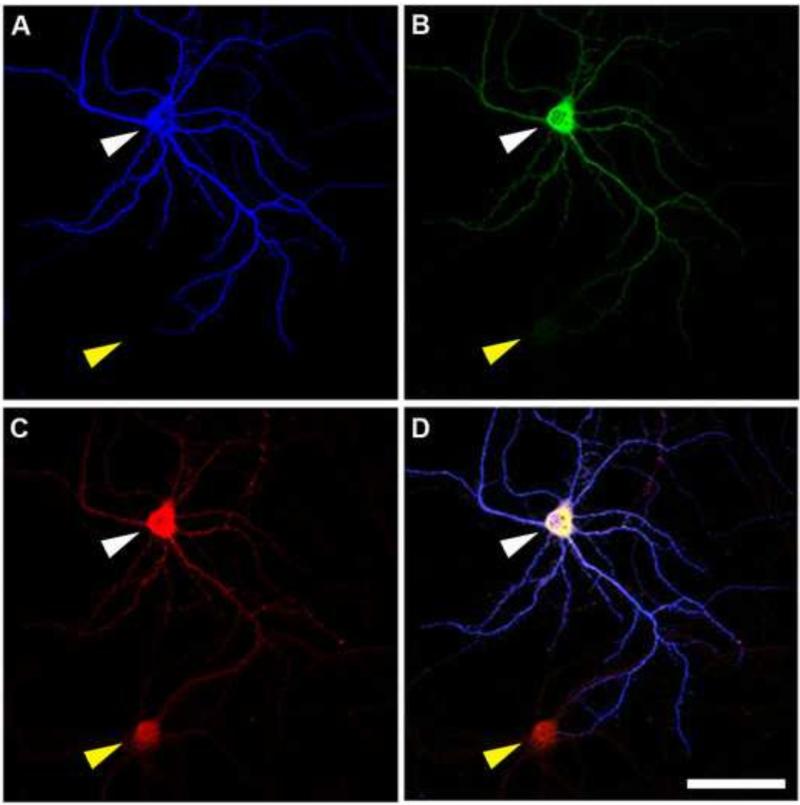
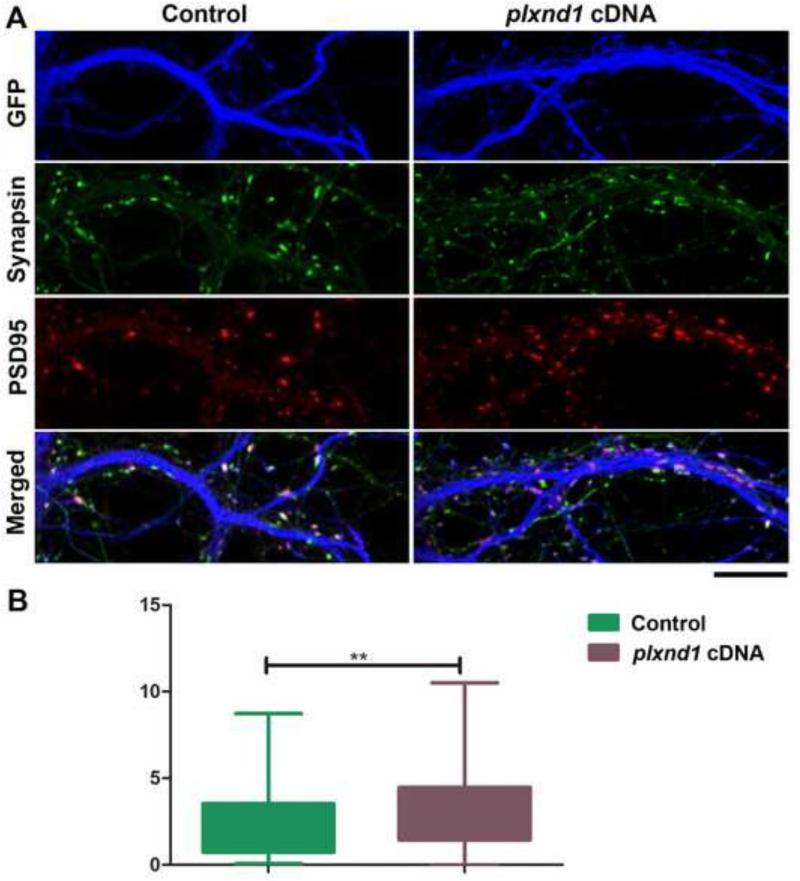
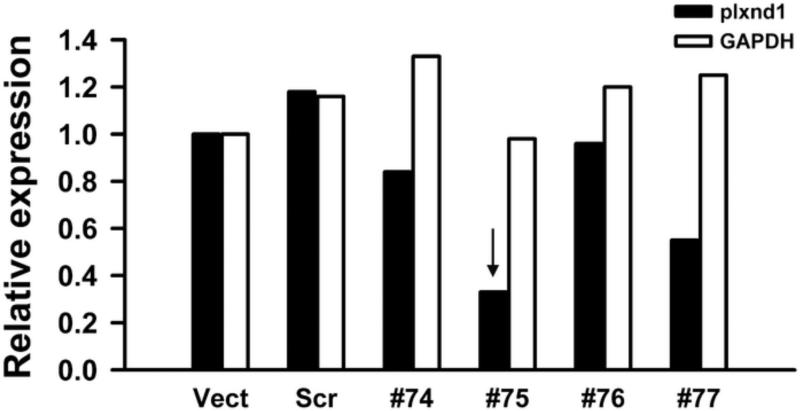
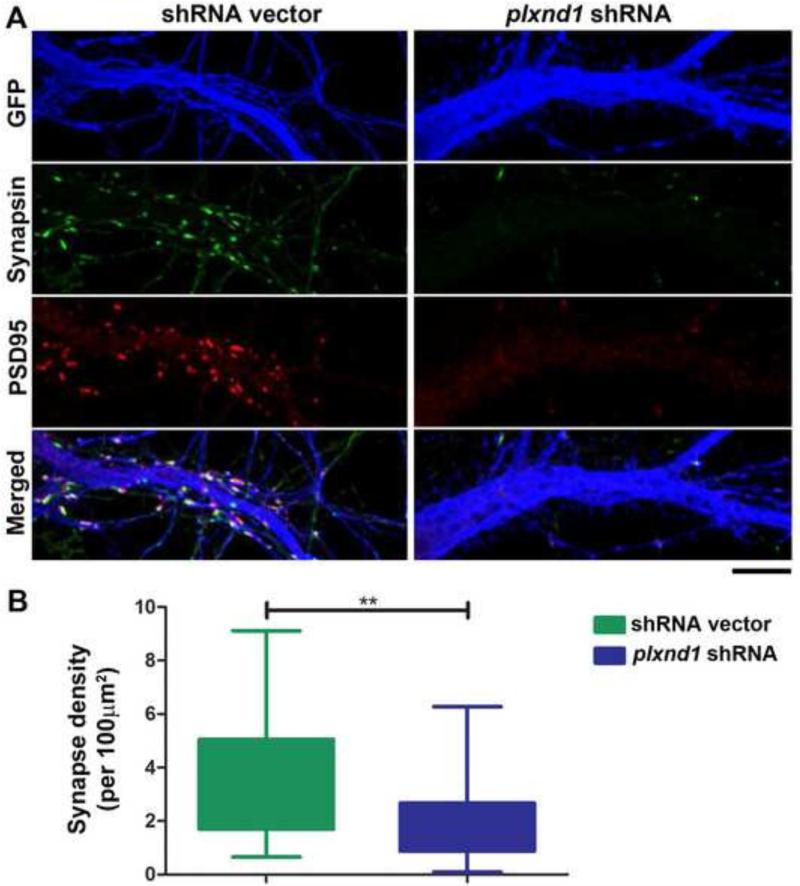
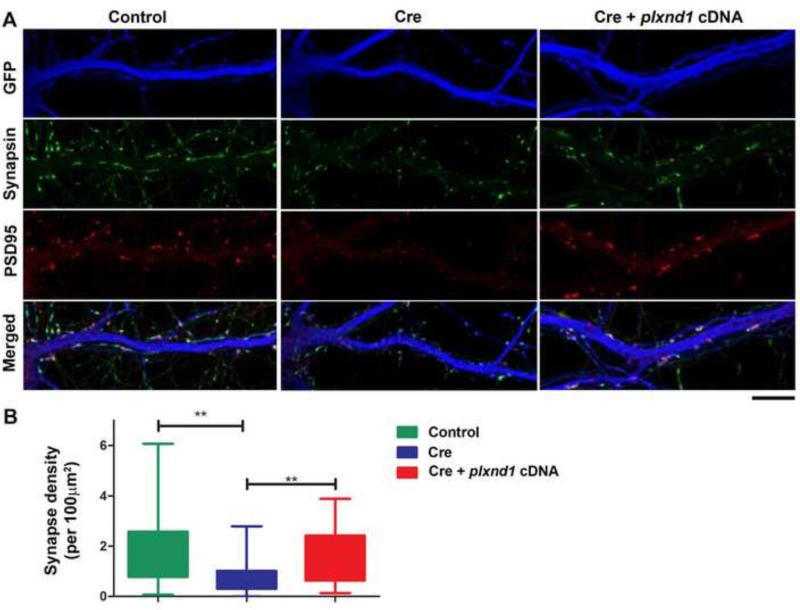
Synapse formation is a critical process during neural development and is coordinated by multiple signals. Several lines of evidence implicate the Plexin-D1 receptor in synaptogenesis. Studies have shown that Plexin-D1 signaling is involved in synaptic specificity and synapse formation in spinal cord and striatum. Expression of Plexin-D1 and its principal neural ligand, Sema3E, by neocortical neurons is temporally and spatially regulated, reaching the highest level at the time of synaptogenesis in mice. In this study, we examined the function of Plexin-D1 in synapse formation by primary neocortical neurons in vitro. A novel, automated image analysis method was developed to quantitate synapse formation under baseline conditions and with manipulation of Plexin-D1 levels. shRNA and overexpression manipulations caused opposite changes, with reduction resulting in less synapse formation, an effect distinct from that reported in the striatum. The data indicate that Plexin-D1 operates in a cell context-specific fashion, mediating different synaptogenic outcomes depending upon neuron type.

Keywords: Image analysis; In vitro; Intracortical; Mouse; Synaptogenesis.


Figures

Figure 1
Figure 1
Semi-automated analysis of synapse density on GFP-transfected neurons. A portion of the proximal dendritic tree of individual GFP-labeled neurons was imaged (A), and the resulting confocal image pseudocolored: GFP, blue; PSD95, red; synapsin-1, green. Schematic diagram (B) and photomicrograph (C) illustrating the criteria used to classify a synapse on a GFP-labeled dendrite (orange arrows – congruent PSD95 and GFP signal, with at least partial overlap of synapsin-1 and PSD95). Congruent PSD95 and GFP signal (olive arrows) or PSD95 and synapsin-1 signal (light blue arrows) could also be observed, but were not included in the synapse count. (D) Comparison between automated and manual counts of the number of synapses associated with GFP-labeled dendrites in images from 10 neurons. The black line represents the simple linear regression model and the red lines represent the 99% confidence intervals. Scale bar: 10 μm.
Figure 2
Figure 2
Transfection of Plxnd1 cDNA at 5 DIV results in increased expression of Plexin-D1 at 14 DIV. Confocal images illustrating immunostaining of neurons at 14 DIV following Plxnd1cDNA over-expression at 5 DIV: white arrowhead, transfected neuron; yellow arrowhead, non-transfected neuron. (A) Transfected neurons could be visualized by the co-transfection of GFP. (B) Plasmid-encoded protein, identified by the V5 epitope tag, was only observed in transfected neurons. (C) Note the increased expression of Plexin-D1 in transfected, compared to neighboring untransfected, cells. A merged image of all three channels is illustrated in (D). Scale bar: 50 μm.
Figure 3
Figure 3
Overexpression of Plexin-D1 increases synaptic density on neocortical neurons in vitro. (A) Confocal images illustrating GFP (blue), synapsin-1 (green), PSD95 (red) and merged signal at 14 DIV following transfection with GFP alone (control, left panels) or GFP and plxnd1 cDNA (right panels) at 5 DIV. Scale bar: 10 μm. B) Quantification of synapse density at 14 DIV reveals a significant increase in synapse density in plxnd1 cDNA-transfected compared to control neurons. N = 115 neurons from 3 independent culturing sessions, **p < 0.01.
Figure 4
Figure 4
Efficiency of knock-down of plexind1 expression in N2A cells. Four plexind1 shRNAs (#74 – 77) were transfected into N2A cells and plexind1 mRNA levels quantified by q-PCR. Vector alone (Vect) and scrambled shRNA (Scr) were used as controls. Note that shRNA #75 had the largest effect (arrow) and was used in subsequent experiments.
Figure 5
Figure 5
Knock-down of Plexin-D1 expression decreases synaptic density on neocortical neurons in vitro. (A) Confocal images illustrating GFP (blue), synapsin-1 (green), PSD95 (red) and merged signal at 14 DIV following transfection with GFP and shRNA vector (control, left panels) or GFP and plxnd1 shRNA (right panels) at 5 DIV. Scale bar: 10 μm. B) Quantification of synapse density at 14 DIV reveals a significant decrease in synapse density in plxnd1 shRNA-transfected compared to control neurons. N = 94 neurons from 2 independent culturing sessions, **p < 0.01.
Figure 6
Figure 6
Genetic knockout of plxnd1 expression decreases synaptic density on neocortical neurons in vitro. (A) Confocal images illustrating GFP (blue), synapsin-1 (green), PSD95 (red) and merged signal at 14 DIV following transfection at 5 DIV with GFP (control, left panels), GFP and cre recombinase (middle panels), or GFP, cre recombinase and plxnd1 cDNA (right panels) into neurons isolated from Plxnd1-floxed mice. Scale bar: 10 μm. B) Quantification of synapse density at 14 DIV reveals a significant decrease in synapse density in knock-out compared to control neurons. Transfection of plxnd1 cDNA into knock-out neurons rescued synapse density. N = 165 neurons from 3 independent culturing sessions, **p < 0.01.

Similar articles

Cited by

References

    1. Akins MR, Biederer T. Cell–cell interactions in synaptogenesis. Curr. Opin. Neurobiol. 2006;16:83–89. - PubMed
    1. Arber S. Motor circuits in action: specification, connectivity, and function. Neuron. 2012;74:975–989. - PubMed
    1. Bellon A, et al. VEGFR2 (KDR/Flk1) signaling mediates axon growth in response to semaphorin 3E in the developing brain. Neuron. 2010;66:205–219. - PubMed
    1. Berg JM, Geschwind DH. Autism genetics: searching for specificity and convergence. Genome Biol. 2012;13:247. - PMC - PubMed
    1. Chauvet S, et al. Gating of Sema3E/PlexinD1 signaling by neuropilin-1 switches axonal repulsion to attraction during brain development. Neuron. 2007;56:807–822. - PMC - PubMed

Publication types

MeSH terms

LinkOut - more resources