. 2015 May 15:5:10206.
doi: 10.1038/srep10206.

Real-time monitoring of cell protrusion dynamics by impedance responses

Affiliations

Real-time monitoring of cell protrusion dynamics by impedance responses

Paolo Armando Gagliardi et al. Sci Rep. .

Abstract

Cellular protrusions are highly dynamic structures involved in fundamental processes, including cell migration and invasion. For a cell to migrate, its leading edge must form protrusions, and then adhere or retract. The spatial and temporal coordination of protrusions and retraction is yet to be fully understood. The study of protrusion dynamics mainly relies on live-microscopy often coupled to fluorescent labeling. Here we report the use of an alternative, label-free, quantitative and rapid assay to analyze protrusion dynamics in a cell population based on the real-time recording of cell activity by means of electronic sensors. Cells are seeded on a plate covered with electrodes and their shape changes map into measured impedance variations. Upon growth factor stimulation the impedance increases due to protrusive activity and decreases following retraction. Compared to microscopy-based methods, impedance measurements are suitable to high-throughput studies on different cell lines, growth factors and chemical compounds. We present data indicating that this assay lends itself to dissect the biochemical signaling pathways controlling adhesive protrusions. Indeed, we show that the protrusion phase is sustained by actin polymerization, directly driven by growth factor stimulation. Contraction instead mainly relies on myosin action, pointing at a pivotal role of myosin in lamellipodia retraction.


Figures

Figure 1
Figure 1. EGF stimulation induces protrusion formation and retraction.
(A) MCF10A cells were infected with pLKO.1 LifeAct-GFP, deprived of EGF for 6 hours and kept in a humidified chamber at 37 °C and 5% CO2. Cells were then imaged by means of TIRF microscopy. The depth of the evanescent field was kept at 90 nm. Cells were imaged over a time period of 1180 seconds and either stimulated or not with 5 ng/ml EGF. The time at which the stimulus was added was set to t = 0 seconds. Images were acquired every 20 seconds (Video S1). Four time-points are reported in the figure: −60 seconds (before EGF addition, quiescent cell), 120 seconds (protrusion), 260 seconds (maximum extension) and 1120 seconds (retraction). Scale bars, 10 μm. (B) Kymograph of a pLKO.1 LifeAct-GFP MCF10A cell stimulated as in A. A segment perpendicular to lamellipodium was used to monitor fluorescence intensity at each time points, and then the different time points were assembled. (C) Cell surface area variation observed by TIRF microscopy of pLKO.1 LifeAct-GFP MCF10A cells stimulated with EGF or unstimulated in which only the medium containing EGF was added (vehicle). Dark thick lines represent the mean values while light shades represent the area included between + SD and – SD.
Figure 2
Figure 2. Real-time evaluation of cell protrusion dynamics by IR.
(A) Baseline Δ cell index values obtained by IR of MCF10A cells stimulated or not with EGF at t = 0. (B) Cartoon showing the indicators that we use for quantification of the IR response to EGF stimulation. The point where the EGF response curve reaches the highest value corresponds to Maximum Cell Index and the Maximum Cell Index Time (tm). The protrusion slope is calculated as the mean slope between t0 and tm, where t0 is the first time point after growth factor addition. The retraction slope is calculated as the mean slope between tm and t2m, where t2m is twice tm. (C) Maximum Cell Index Time (tm) of a number of experiments performed by means of TIRF microscopy or IR of MCF10A stimulates with 10 ng/ml of EGF. Each point represents a separate experiment. Dashes represent the mean values. (D) Protrusion slope, (E) retraction slope and (F) maximum value of Baseline Δ cell index curve of MCF10A stimulated or not with 5 ng/ml EGF. ***P < 0.001.
Figure 3
Figure 3. EGF affects protrusion dynamics in a concentration dependent manner.
5 × 103 MCF10A cells were deprived of EGF for 6 hours and stimulated with increasing concentrations of EGF. (A) IR of MCF10A cells stimulated with 0.3, 1, 3, 10, 30 ng/ml of EGF. (B) Protrusion slope, (C) retraction slope and (D) maximum value of Baseline Δ cell index in function of EGF concentration.
Figure 4
Figure 4. IR of protrusion dynamics in different cellular models and growth factors.
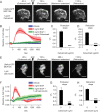
(A) MCF10A cells were infected with pLKO.1 LifeAct-GFP, deprived of growth factors for 6 hours and kept in a humidified chamber at 37 °C and 5% CO2. Cells were then imaged by means of TIRF microscopy. The depth of the evanescent field was kept at 90 nm. Cells were imaged over a time period of 1780 seconds and stimulated or not with 50 ng/ml HGF. The time at which the stimulus was added was set to t = 0 seconds. Images were acquired every 20 seconds (Video S2). Four time-points are reported in the figure: −60 seconds (before HGF addition, quiescent cell), 240 seconds (protrusion), 500 seconds (maximum extension) and 1700 seconds (retraction). Scale bars, 10 μm. (B) Baseline Δ cell index values of MCF10A cells stimulated or not with 50 ng/ml HGF at t = 0. (C) Baseline Δ cell index values of HUVECs stimulated or not 10 ng/ml VEGF. (D) Baseline Δ cell index values of A431 cells stimulated or not with 5 ng/ml EGF.
Figure 5
Figure 5. Protrusion is regulated by a signalling pathway starting from EGFR and culminating in actin polymerization.
(A) MCF10A cells, stably transduced with pLKO.1 LifeAct-GFP, were seeded and maintained in absence of growth factors for 6 hours, pretreated with 1 μg/ml Cetuximab and stimulated with 5 ng/ml EGF at t = 0. Time lapse movie at TIRF microscope of a representative cell (Video S3) was recorded with interval of 20 seconds. Scale bars, 10 μm. (B) Baseline Δ cell index values, (C) protrusion slope and (D) retraction slope of MCF10A treated or not with 1 μg/ml Cetuximab during growth factors deprivation and stimulated with 5 ng/ml EGF, evaluated by IR. (E) A representative MCF10A cell, stably transduced with pLKO.1 LifeAct-GFP, was stimulated with 5 ng/ml EGF in presence of 1 μM Latrunculin (Video S4). Scale bars, 10 μm. (F) Baseline Δ cell index values, (G) protrusion slope and (H) retraction slope of MCF10A treated or not with 1 μM Latrunculin during growth factors deprivation, stimulated with 5 ng/ml EGF and evaluated by IR. ***P < 0.001.
Figure 6
Figure 6. IR of filopodia and the effect of myosin inhibition.
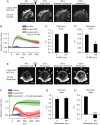
(A) MCF10A cells, stably transduced with pLKO.1 LifeAct-GFP, were seeded and maintained in absence of growth factors for 6 hours, pretreated with 100 μM CK-666 and stimulated with 5 ng/ml EGF at t = 0. Time lapse movie at TIRF microscope of a representative cell (Video S5) recorded with interval of 20 seconds. Scale bars, 10 μm. (B) Baseline Δ cell index values, (C) protrusion slope and (D) retraction slope of MCF10A treated or not with 100 μM CK-666 during growth factors deprivation, stimulated with 5 ng/ml EGF and evaluated by IR. (E) A MCF10A cell, stably transduced with pLKO.1 LifeAct-GFP stimulated with 5 ng/ml EGF in presence of 100 μM Blebbistatin (Video S6). Newly formed lamellipodia are indicated with white arrows. Scale bars, 10 μm. (F) Baseline Δ cell index values, (G) protrusion slope and (H) retraction slope of MCF10A treated or not with 100 μM Blebbistatin during growth factors deprivation, stimulated with 5 ng/ml EGF and evaluated by IR. **P < 0.05, ***P < 0.001.

Similar articles

Cited by

References

    1. Ridley A. J. Life at the leading edge. Cell 145, 1012–1022 (2011). - PubMed
    1. Petrie R. J. & Yamada K. M. At the leading edge of three-dimensional cell migration. Journal of cell science 125, 5917–5926 (2012). - PMC - PubMed
    1. Abercrombie M., Heaysman J. E. & Pegrum S. M. The locomotion of fibroblasts in culture. II. “RRuffling”. Experimental cell research 60, 437–444 (1970). - PubMed
    1. Petrie R. J., Gavara N., Chadwick R. S. & Yamada K. M. Nonpolarized signaling reveals two distinct modes of 3D cell migration. The Journal of cell biology 197, 439–455 (2012). - PMC - PubMed
    1. Albrecht-Buehler G. Filopodia of spreading 3T3 cells. Do they have a substrate-exploring function? The Journal of cell biology 69, 275–286 (1976). - PMC - PubMed

Publication types

MeSH terms