. 2015 May 15;348(6236):808-12.
doi: 10.1126/science.aaa3923.

Centrosomes. Regulated assembly of a supramolecular centrosome scaffold in vitro

Affiliations

Centrosomes. Regulated assembly of a supramolecular centrosome scaffold in vitro

Jeffrey B Woodruff et al. Science. .

Abstract

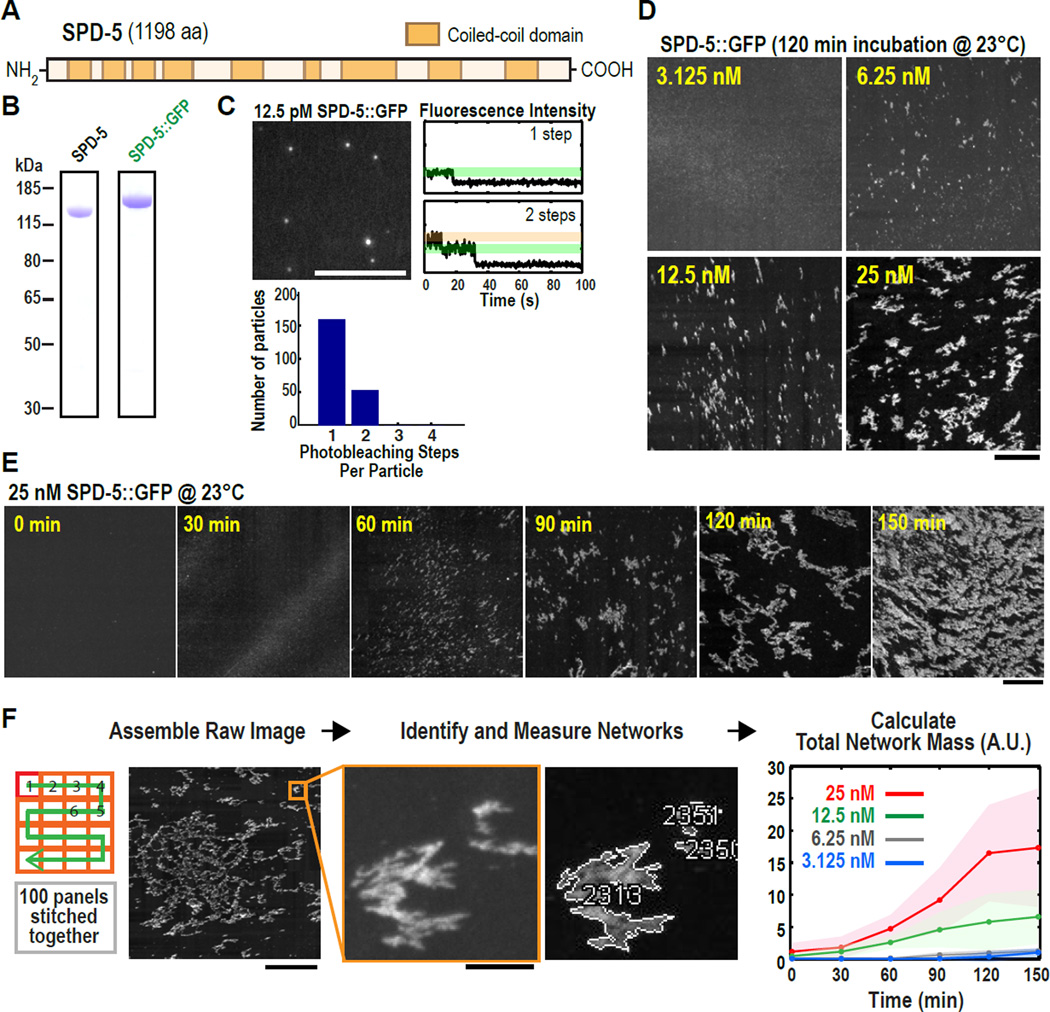
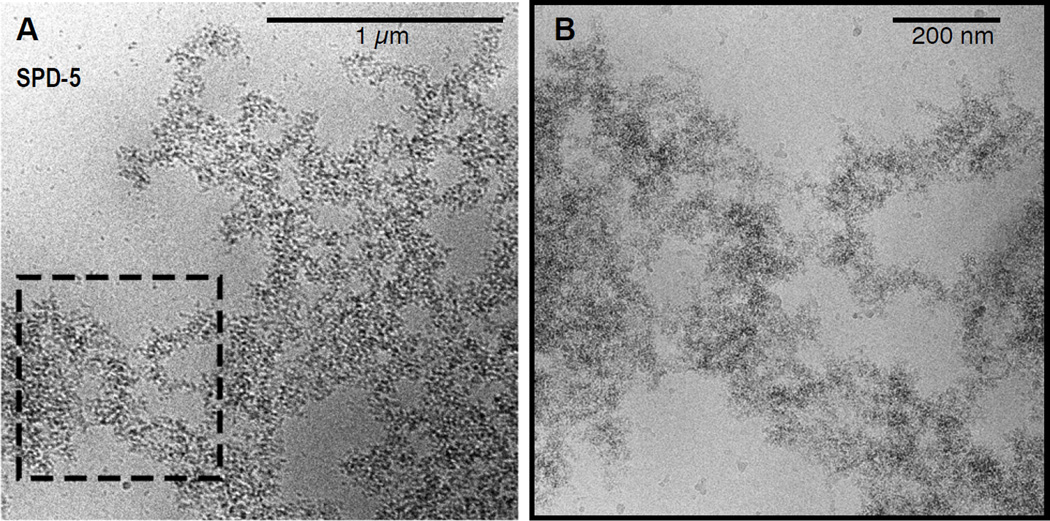
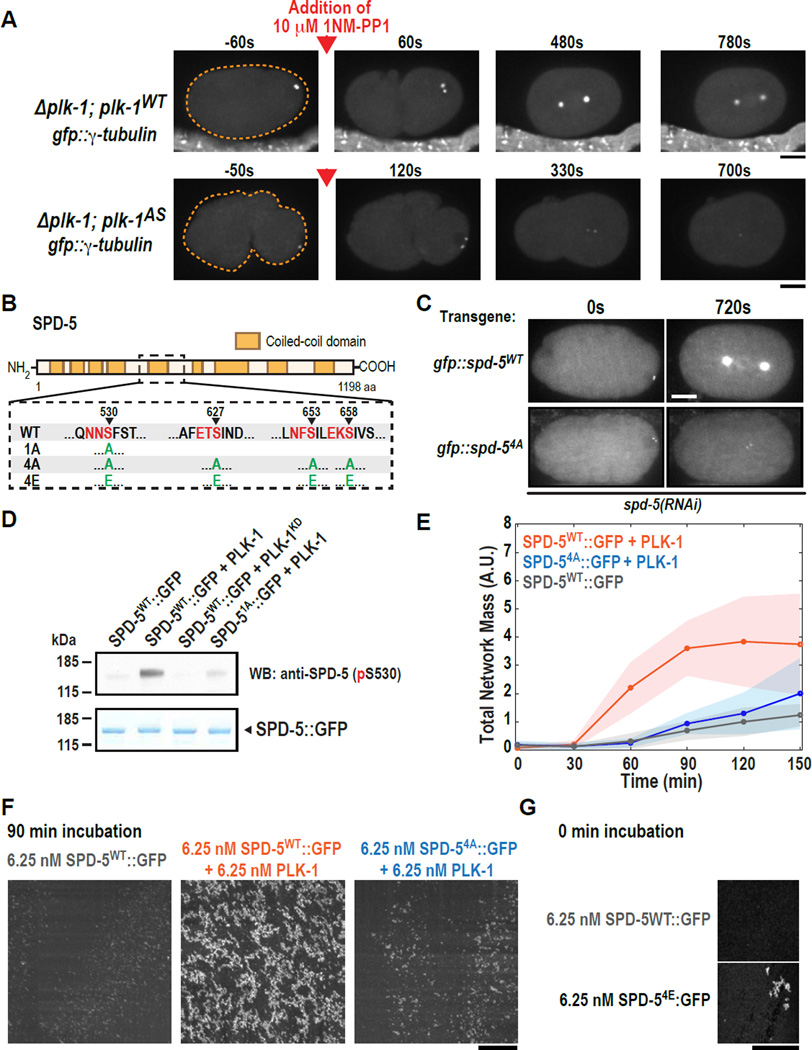
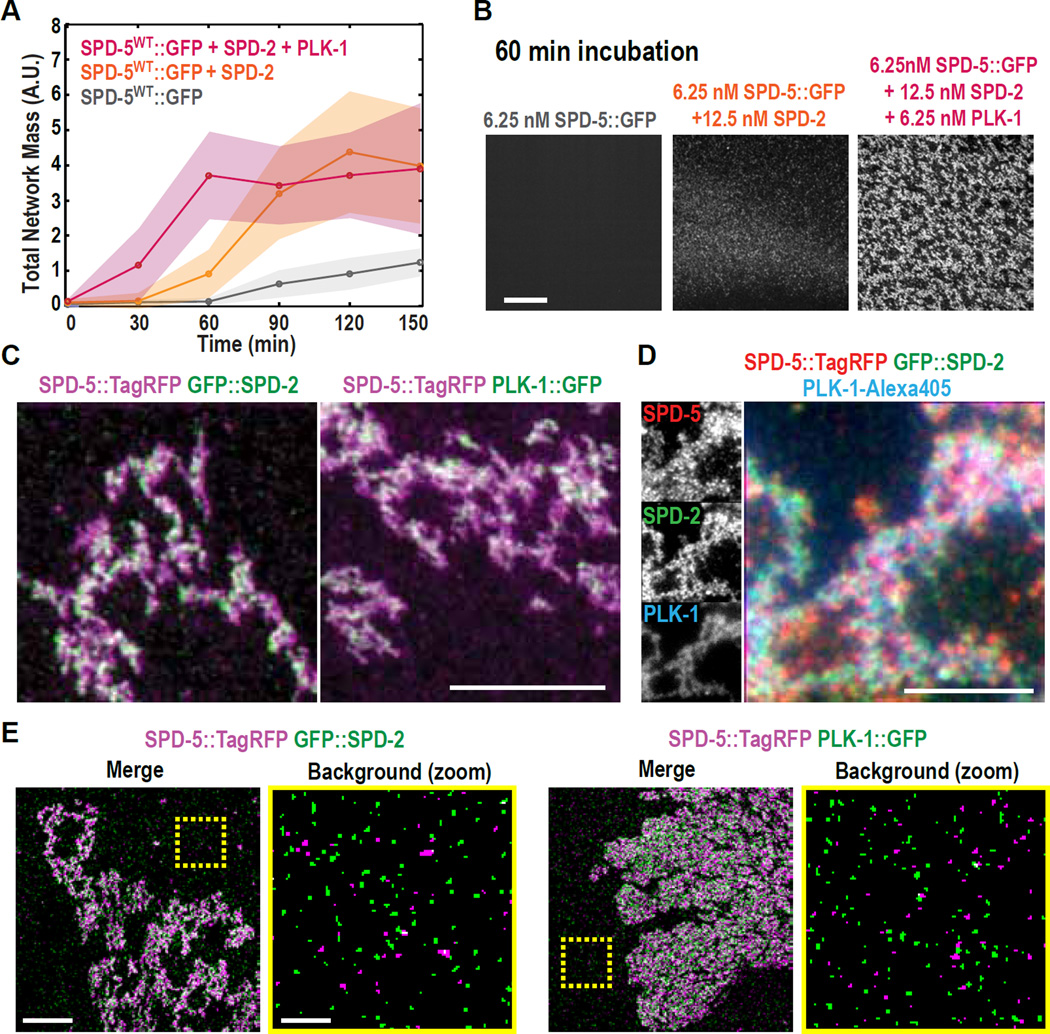
The centrosome organizes microtubule arrays within animal cells and comprises two centrioles surrounded by an amorphous protein mass called the pericentriolar material (PCM). Despite the importance of centrosomes as microtubule-organizing centers, the mechanism and regulation of PCM assembly are not well understood. In Caenorhabditis elegans, PCM assembly requires the coiled-coil protein SPD-5. We found that recombinant SPD-5 could polymerize to form micrometer-sized porous networks in vitro. Network assembly was accelerated by two conserved regulators that control PCM assembly in vivo, Polo-like kinase-1 and SPD-2/Cep192. Only the assembled SPD-5 networks, and not unassembled SPD-5 protein, functioned as a scaffold for other PCM proteins. Thus, PCM size and binding capacity emerge from the regulated polymerization of one coiled-coil protein to form a porous network.


Figures

Fig. 1
Fig. 1. Recombinant SPD-5 molecules polymerize into expansive networks over time in a concentration-dependent manner in vitro
(A) SPD-5 sequence with coiled-coil domains predicted by the MARCOIL algorithm (31) at 90% threshold. (B) Coomassie-stained gels depicting purified full-length SPD-5 and SPD-5::GFP. (C) 12.5 pM SPD-5::GFP was squashed under a cover slip and imaged continuously by total internal reflection microscopy. The intensity of each fluorescent spot was measured over time and photobleaching steps per spot were counted (n = 210). Representative photobleaching profiles are shown. Scale bar, 5 µm. (D) Visualization of different concentrations of SPD-5::GFP after 120 min. Scale bar, 25 µm. (E) 25 nM SPD-5::GFP was incubated at 23°C, then squashed under a coverslip at 30 min intervals. Scale bar, 25 µm. (F) Flowchart of automated SPD-5::GFP network quantification. For each sample, 100 images were collected, stitched together, a threshold was applied, and the networks were identified and measured. The graph plots the integrated intensity of all networks (Total Network Mass) per sample at each time point (n= 4–10; mean with 95% confidence intervals). Scale bars, 25 µm (first panel), 2.5 µm (inset).
Fig. 2
Fig. 2. High-resolution imaging of SPD-5 networks with Cryo-electron microscopy
(A) Cryo-electron microscopy image of untagged SPD-5. (B) Higher magnification view.
Fig. 3
Fig. 3. PLK-1 phosphorylation of SPD-5 drives PCM assembly in vivo and SPD-5 polymerization in vitro
(A) plk-1WT (n=9) and plk-1AS (n=13) embryos expressing the PCM marker GFP::γ-tubulin were visualized by fluorescence confocal microscopy (orange dashed line is embryo outline). 10 µM 1-NM-PP1 (PLK-1AS inhibitor) was added to permeabilized embryos prior to mitotic entry (red arrow). (B) Diagram of phospho-epitopes on SPD-5 and different mutant constructs. Canonical PLK-1 consensus motifs (32, 33) are indicated in red. The arrowheads indicate the phosphorylated residue in each motif. The complete set of phosphorylation sites identified by MS/MS is included in Table S3. (C) Centrosome size was visualized in embryos expressing RNAi-resistant GFP::SPD-5WT or GFP::SPD-54A. Images are sum intensity projections from z-stacks. Scale bar, 25 µm. See also Fig. S3. (D) In vitro kinase assay. SPD-5WT::GFP was incubated with buffer alone, PLK-1WT, or a kinase dead version of PLK-1 (PLK-1KD). Phosphorylation at serine 530 was detected by western blot using a phospho-specific antibody. (E) Kinetics of 6.25 nM SPD-5WT::GFP network formation in vitro. Values represent mean with 95% confidence intervals (n= 8–14). (F) Representative images of SPD-5::GFP networks from (E). Scale bar, 25 µm. (G) A phosphomitetic version of SPD-5 (SPD-54E::GFP) already formed networks at t = 0 min, bypassing the need for incubation at room temperature. Scale bar, 25 µm.
Fig. 4
Fig. 4. SPD-2 and PLK-1 independently bind to SPD-5::GFP networks and cooperatively stimulate network formation in vitro
(A) Kinetics of 6.25 nM SPD-5::GFP network formation in the presence of 12.5 nM SPD-2 and/or 6.25 nM PLK-1. Values represent mean with 95% confidence intervals (n= 8–14). (B) Representative images of SPD-5::GFP networks from (A) after 60 min. Scale bar, 25 µm. (C) Dual color images of SPD-5::TagRFP networks assembled in the presence of GFP::SPD-2 or PLK-1::GFP. Scale bar, 5 µm. See also Figure S6. (D) Triple color images of SPD-5::TagRFP networks assembled in the presence of GFP::SPD-2 and PLK-1-Alexa405. Scale bar, 5 µm. (E) Co-localization analysis using structured illumination microscopy. For each image pair, the right panel depicts a zoomed-in image of the non-network-assembled SPD-5::TagRFP particles selected from the area bounded by the yellow box. Scale bar, 5 µm (left panel), 1 µm (zoomed in, right panel).

References

    1. Nigg EA, Raff JW. Cell. 2009;139:663–678. - PubMed
    1. Woodruff JB, Wueseke O, Hyman AA. Phil. Trans. R. Soc. B. 2014;369:1–10. - PMC - PubMed
    1. Dictenberg JB, et al. J. Cell Biol. 1998;141:163–174. - PMC - PubMed
    1. Zimmerman WC, Sillibourne J, Rosa J, Doxsey SJ. Mol. Biol. Cell. 2004;15:3642–3657. - PMC - PubMed
    1. Buchman JJ, et al. Neuron. 2010;66:386–402. - PubMed

Publication types

MeSH terms