. 2014 May 27:1:140003.
doi: 10.1038/sdata.2014.3. eCollection 2014.

A high-resolution 7-Tesla fMRI dataset from complex natural stimulation with an audio movie

Affiliations

A high-resolution 7-Tesla fMRI dataset from complex natural stimulation with an audio movie

Michael Hanke et al. Sci Data. .

Abstract

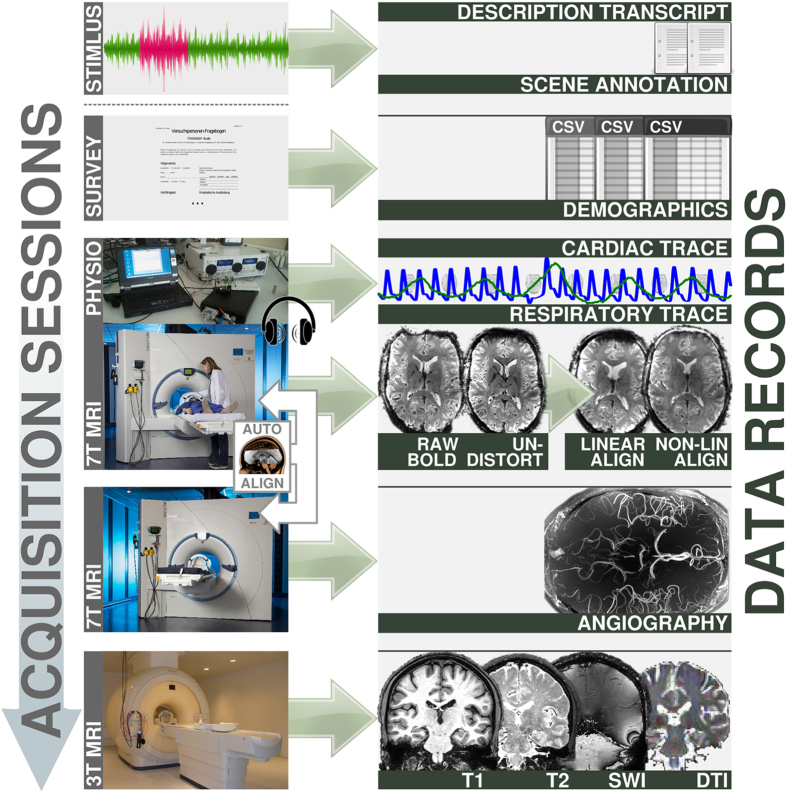
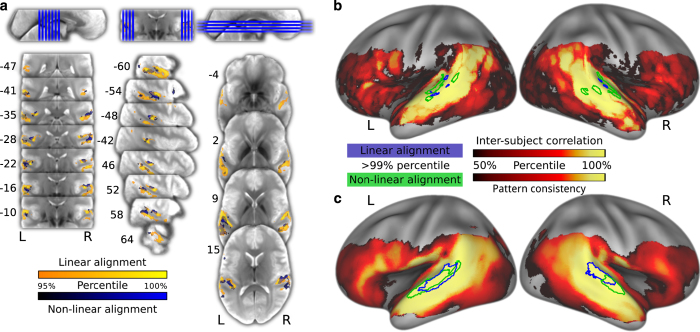
Here we present a high-resolution functional magnetic resonance (fMRI) dataset - 20 participants recorded at high field strength (7 Tesla) during prolonged stimulation with an auditory feature film ("Forrest Gump"). In addition, a comprehensive set of auxiliary data (T1w, T2w, DTI, susceptibility-weighted image, angiography) as well as measurements to assess technical and physiological noise components have been acquired. An initial analysis confirms that these data can be used to study common and idiosyncratic brain response patterns to complex auditory stimulation. Among the potential uses of this dataset are the study of auditory attention and cognition, language and music perception, and social perception. The auxiliary measurements enable a large variety of additional analysis strategies that relate functional response patterns to structural properties of the brain. Alongside the acquired data, we provide source code and detailed information on all employed procedures - from stimulus creation to data analysis. In order to facilitate replicative and derived works, only free and open-source software was utilized.


Conflict of interest statement

The authors declare no competing financial interests.

Figures

Figure 1
Figure 1
Data acquisition workflow and relation to data records. Acquisition was split into three imaging sessions and a survey. Physiological measurements were recorded simultaneous with the functional MRI during auditory stimulation. MRI data acquistion at 7 Tesla was performed with partial brain coverage. The measurement field-of-view was automatically aligned across sessions and participants. (7 T MRI photo courtesy of the Center for Behavioral Brain Sciences/D. Mahler; 3 T MRI photo courtesy of the Leibniz Institute for Neurobiology/A. Fügner).
Figure 2
Figure 2
Field-of-view for the fMRI data acquisition. (a) Custom T2* EPI group template (in gray), linearly aligned to and overlaid on the MNI152 T1-weighted head template (in amber). The EPI template was created by an iterative procedure with four linear and ten non-linear alignment steps out of one sample volume per run and brain (a total of 152 images; images from participant 10 were excluded; see Table 3, slice cut point: anterior commissure at MNI 0,0,0 mm). (b) Intersection masks after linear and non-linear anatomical alignment of all mean volumes for all individual fMRI runs across all participants. The linear intersection mask is depicted in blue, non-linear in yellow (overlap in green). Coordinates are in MNI millimeters.
Figure 3
Figure 3
Stimulus synchronization and timing accuracy. (a) Schema for movie segment transitions and synchronization with the MRI scanner's volume acquisition trigger signal. The solid black line shows the relative stimulus volume at the beginning and end of a movie segment. (b) Histogram of inter-trigger pulse duration deviations from the target duration of 2 s – as recorded by the stimulus software. This is an estimate of the temporal uncertainty of the timing information. Trigger pulses are sent by the MRI scanner at precise intervals of 2 s at the start of each volume. (c) Histogram of movie onset latencies (deviation from the respective trigger pulse) as reported by the stimulus software. This is a worst-case estimate that includes all file access latencies and indicates the complete latency until the underlying movie presentation engine reports the start of a movie segment back to the stimulus software. (d) Histogram of deviations of movie segment duration from target duration. All histograms are normalized and aggregate information across all participants.
Figure 4
Figure 4
Temporal noise estimates. (a) Distribution of the temporal signal-to-noise ratio (tSNR) computed from the temporally de-trended gel phantom dataset. The left side of the panel shows the spatial distribution in arbitrarily selected slices. The right side shows a tSNR histogram across all voxels inside the phantom. (b) Motion estimates relative to reference at the beginning of each scan session. The area shaded in light gray depicts the range across participants, while the dark gray area shows the standard error of the mean. The dark gray line indicates the median estimate. Dashed vertical lines indicate run boundaries where participants had a brief break. The solid vertical line indicates the scan session boundary where participants left the scanner for a longer break and a new reference image was recorded afterwards. Data from participant 10 have been excluded as no valid reference image was available. As a reference, the black line shows the estimated motion of the phantom recording.
Figure 5
Figure 5
Area of maximum inter-individual response similarity. (a) Representative slices of the group EPI template depicting the 95% percentile of univariate inter-brain time-series correlations for linear (blue) and non-linear (yellow) alignment in the group EPI template space. (b) Distribution of percent ranks of mean inter-brain correlations on the cortical surface. The statistical map is thresholded at percent rank=50%. The colored outlines depict the 99% percentile for linear (blue) and non-linear (green) alignment. (c) Analog to panel B, depicting the distribution of multivariate 2nd-order pattern consistency. Projection onto the surface was performed using Caret 5.64 with the PALS-B12 atlas.

Similar articles

Cited by

References

Data Citations

    1. Hanke M., Baumgartner F. J., Ibe P., Kaule F. R., Pollmann S., Speck O., Zinke W., Stadler J. 2014. OpenfMRI. ds000113 - PMC - PubMed

References

    1. Shepherd S., Steckenfinger S., Hasson U. & Ghazanfar A. Human-monkey gaze correlations reveal convergent and divergent patterns of movie viewing. Curr Biol. 20, 649–656 (2010). - PMC - PubMed
    1. Berg D., Boehnke S., Marino R., Munoz D. & Itti L. Free viewing of dynamic stimuli by humans and monkeys. J. Vision 9 (2009). - PubMed
    1. Itti L. & Koch C. Computational modeling of visual attention. Nat. Rev. Neurosci. 2, 194–203 (2001). - PubMed
    1. Dorr M., Martinetz T., Gegenfurtner K. & Barth E. Variability of eye movements when viewing dynamic natural scenes. J. Vision 10, 28 (2010). - PubMed
    1. Wang H., Freeman J., Merriam E., Hasson U. & Heeger D. Temporal eye movement strategies during naturalistic viewing. J. Vision 12, 16 (2012). - PMC - PubMed

Publication types