. 2014 Jun 10:1:140011.
doi: 10.1038/sdata.2014.11. eCollection 2014.

Genomes and phenomes of a population of outbred rats and its progenitors

Collaborators, Affiliations

Genomes and phenomes of a population of outbred rats and its progenitors

Amelie Baud et al. Sci Data. .

Erratum in

Abstract

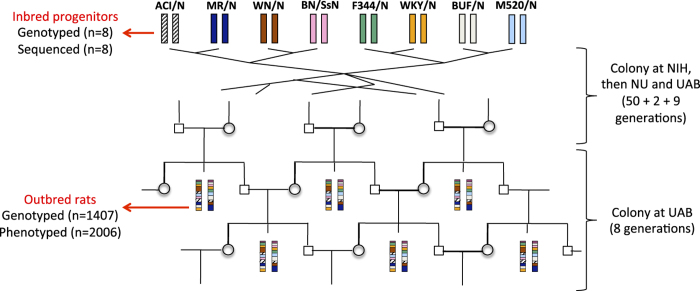
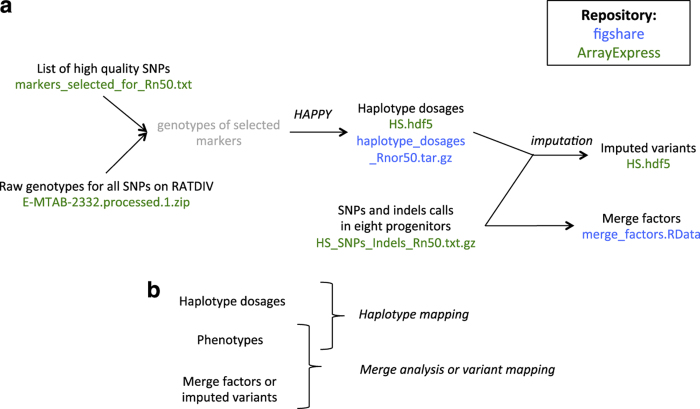
Finding genetic variants that contribute to phenotypic variation is one of the main challenges of modern genetics. We used an outbred population of rats (Heterogeneous Stock, HS) in a combined sequence-based and genetic mapping analysis to identify sequence variants and genes contributing to complex traits of biomedical relevance. Here we describe the sequences of the eight inbred progenitors of the HS and the variants that segregate between them. We report the genotyping of 1,407 HS rats, and the collection from 2,006 rats of 195 phenotypic measures that are relevant to models of anxiety, type 2 diabetes, hypertension and osteoporosis. We make available haplotype dosages for the 1,407 genotyped rats, since genetic mapping in the HS is best carried out by reconstructing each HS chromosome as a mosaic of the progenitor genomes. Finally, we have deposited an R object that makes it easy to incorporate our sequence data into any genetic study of HS rats. Our genetic data are available for both Rnor3.4 and Rnor5.0 rat assemblies.


Conflict of interest statement

The authors declare no competing financial interests.

Figures

Figure 1
Figure 1. Experimental design and data collected.
The Heterogeneous Stock is descended from eight inbred progenitors through more than 60 generations of outbreeding. As a result, each HS rat chromosome is a fine-grained mosaic of the founder genomes. The outbred rats included in this study were from generations 62 to 70 and were bred at the University of Barcelona (UAB). NIH: National Institute of Health; NU: Northwestern University (see methods). The data collected are shown on the left hand side of the figure, with the number of observation for each indicated in brackets.
Figure 2
Figure 2. Generation and use of derived genetic data.
(a) This flow chart shows how the derived genetic data (haplotypes dosages, merge factors, imputed variants) were obtained from the raw data. The name of the file corresponding to each data item is shown, and coloured in green when it was submitted to ArrayExpress (Data Citation 1), and blue when it was submitted to figshare (Data Citation 2). (b) Data to combine for genetic mapping and merge analysis.
Figure 3
Figure 3. Genotyping quality control.
(a) Genotyping samples shown in the hybridization signal space (A−B; (A+B/2)) used by BRLMM-P for calling genotypes. A and B are the raw hybridization signals in the CEL files. Each dot represents a sample. Homozygote calls are coloured in red and yellow, heterozygote calls in orange and uncalled samples in blue. Only markers showing three large, well-resolved clusters with few uncalled samples were selected for haplotype reconstruction. (b) Principal component analysis (PCA) of the genotype calls. Each dot is a sample. The position of the samples on the first two principal components. Those samples genotyped at CNG are coloured in blue, those genotyped at the MDC in red. The genotypes were encoded as 0,1,2 for this analysis, missing values were replaced by the minor allele frequency of the SNP, and the PCA was carried out without centering or scaling the genotypes.

Comment in

  • Ctrl alt share.
    [No authors listed] [No authors listed] Sci Data. 2015 Feb 17;2:150004. doi: 10.1038/sdata.2015.4. eCollection 2015. Sci Data. 2015. PMID: 25977811 Free PMC article. No abstract available.

References

Data Citations

    1. The Rat Genome Sequencing and Mapping Consortium 2014. ArrayExpress. E-MTAB-2332
    1. The Rat Genome Sequencing and Mapping Consortium 2014. Figshare. http://dx.doi.org/10.6084/m9.figshare.943485 - DOI

References

    1. Flint J., Eskin E. Genome-wide association studies in mice. Nat. Rev. Genet. 13, 807–817 (2012). - PMC - PubMed
    1. Rivas M. A. et al. Deep resequencing of GWAS loci identifies independent rare variants associated with inflammatory bowel disease. Nat. Genet. 43, 1066–1073 (2011). - PMC - PubMed
    1. Visscher P. M., Brown M. A., McCarthy M. I., Yang J. Five years of GWAS discovery. Am. J. Hum. Gen. 90, 7–24 (2012). - PMC - PubMed
    1. Rat Genome Sequencing and Mapping Consortium. Combined sequence-based and genetic mapping analysis of complex traits in outbred rats. Nat. Genet. 45, 767–775 (2013). - PMC - PubMed
    1. Hansen C., Spuhler K. Development of the National Institutes of Health genetically heterogeneous rat stock. Alcohol. Clin. Exp. Res. 8, 477–479 (1984). - PubMed

LinkOut - more resources