. 2014 Dec 23:1:140046.
doi: 10.1038/sdata.2014.46. eCollection 2014.

Synaptic molecular imaging in spared and deprived columns of mouse barrel cortex with array tomography

Affiliations

Synaptic molecular imaging in spared and deprived columns of mouse barrel cortex with array tomography

Nicholas C Weiler et al. Sci Data. .

Abstract

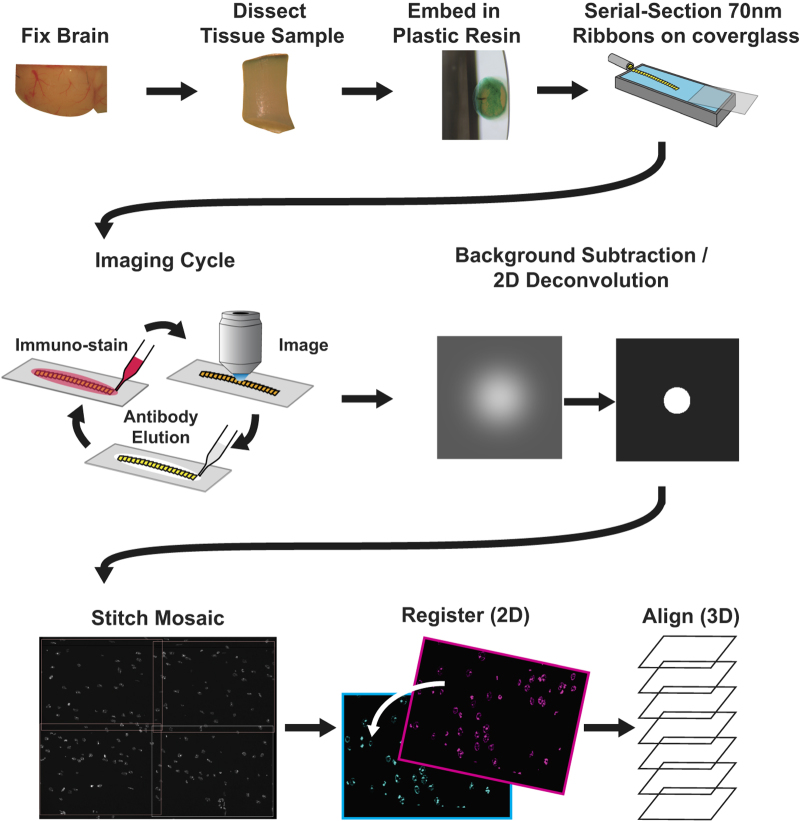
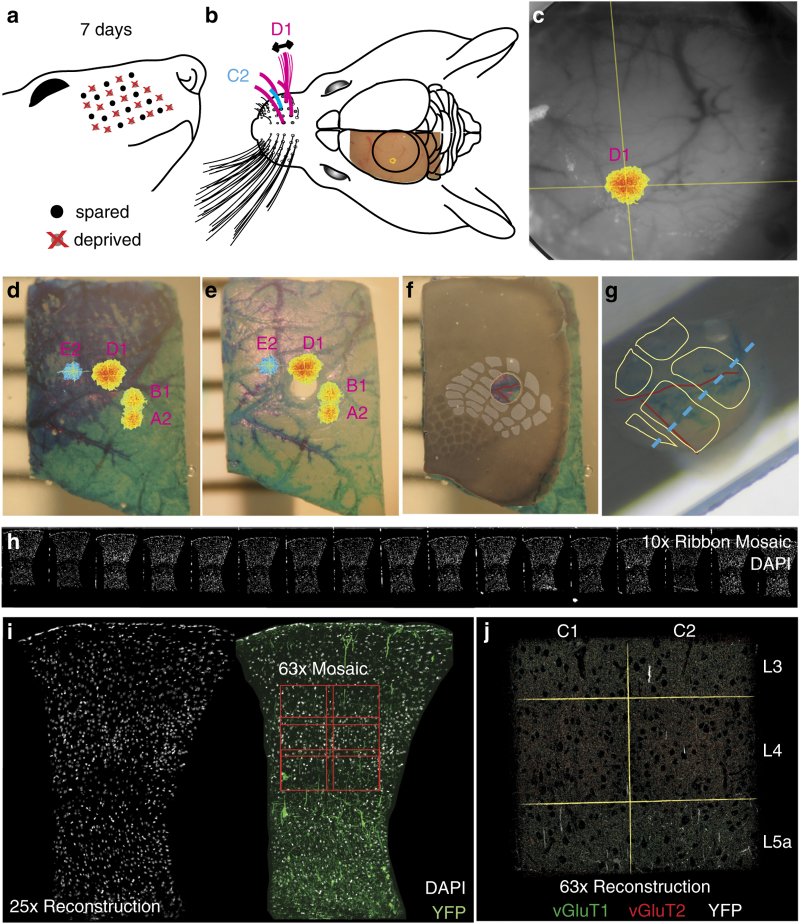
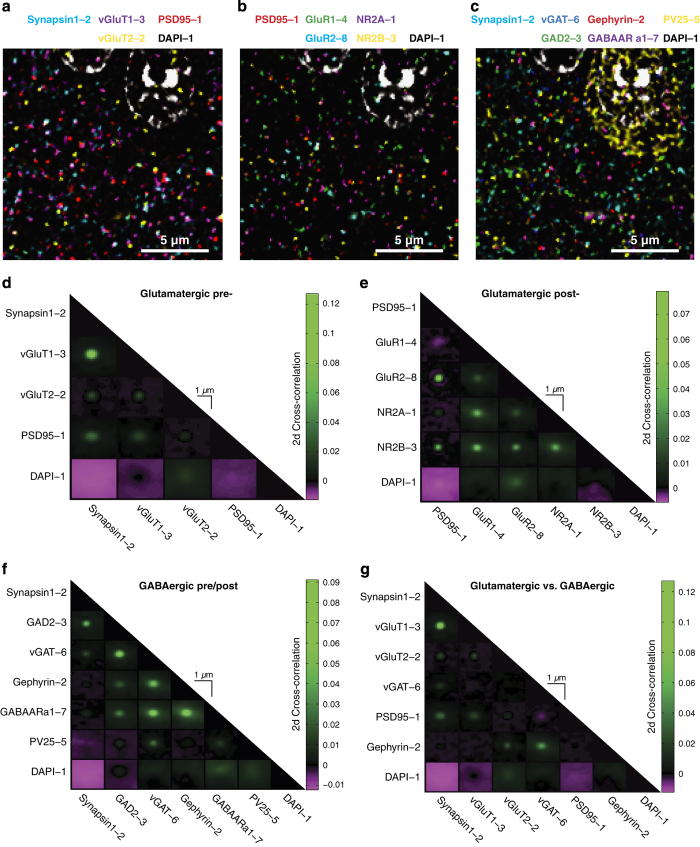
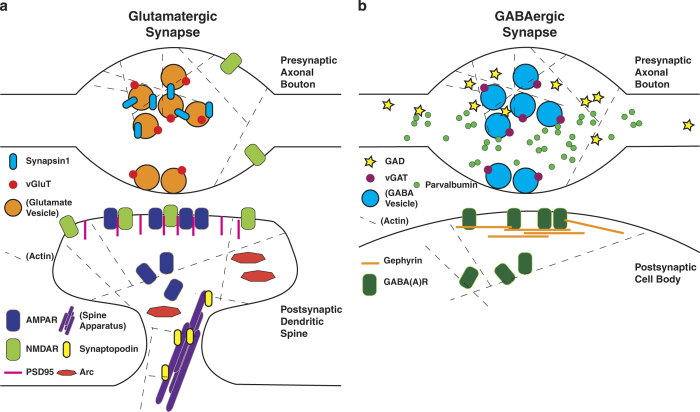
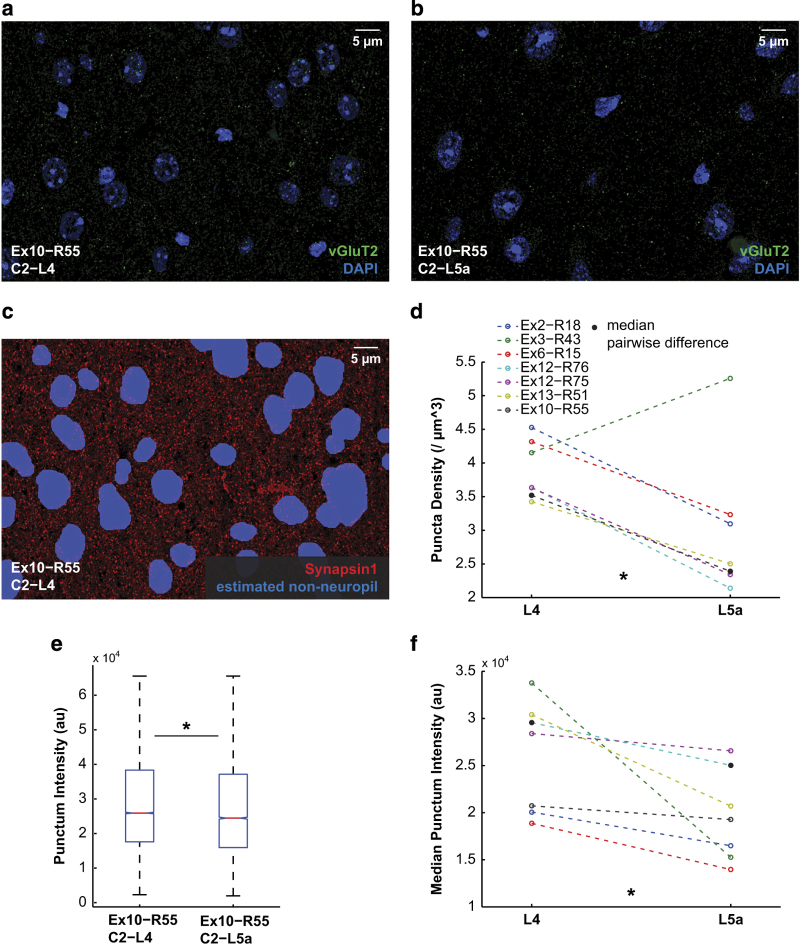
A major question in neuroscience is how diverse subsets of synaptic connections in neural circuits are affected by experience dependent plasticity to form the basis for behavioral learning and memory. Differences in protein expression patterns at individual synapses could constitute a key to understanding both synaptic diversity and the effects of plasticity at different synapse populations. Our approach to this question leverages the immunohistochemical multiplexing capability of array tomography (ATomo) and the columnar organization of mouse barrel cortex to create a dataset comprising high resolution volumetric images of spared and deprived cortical whisker barrels stained for over a dozen synaptic molecules each. These dataset has been made available through the Open Connectome Project for interactive online viewing, and may also be downloaded for offline analysis using web, Matlab, and other interfaces.


Conflict of interest statement

S.J.S. has a founder’s interest in a company (Aratome) that is seeking to commercialize array tomography. The remaining authors declare no competing financial interests.

Figures

Figure 1
Figure 1. Pipeline of ATomo imaging and reconstruction.
Top Row: array production. Fixed brain tissue is dissected into a small sample, in this case a tissue punch, and embedded in resin (generally LR White). This embedded sample is sectioned into ribbons of ultrathin (50–200 nm) serial sections, which are each affixed to a microscope coverglass to form a stable array. Middle Row: imaging and image processing. A ribbon array is stained with antibodies against selected antigens, and indirect immunofluorescence (IF) is imaged using a high-resolution objective. The antibodies can be removed from the ribbon using a high-pH elution solution, and the array can then be used again for multiple cycles of immunostaining and imaging. Image processing software improves the resolution of the resulting images. Bottom Row: volume reconstruction. Custom software is used for stitching, registration, and alignment of acquired images into volumetric reconstructions of the original tissue sample. ‘Mosaics’ comprising multiple microscope fields of view are stitched into individual images of the same location in each serial section across the ribbon. Images of each serial section from different imaging sessions (with different antibody stains applied) are then registered into the same 2-dimensional data space. Serial sections are then three-dimensionally aligned with one another across the ribbon. Software used for image processing and reconstruction can be found at http://smithlabsoftware.googlecode.com.
Figure 2
Figure 2. Functionally guided barrel column extraction.
(a) Chessboard pattern of whisker deprivation. (b) Spared whiskers (magenta) surrounding the C2 whisker (cyan) were stimulated in anesthetized mice. Intrinsic optical signal (IOS) imaged transcranially over left somatosensory cortex (S1). (c) In vivo images of D1-whisker stimulation-evoked IOS peak (pseudocolor) and cerebral surface vasculature (grayscale). (d) Fixed and dissected left S1 cortex with tissue paint and registered IOS peaks (pseudocolor). (e) Remainder tissue after removal of tissue punch centered on the C2 whisker column. (f) Cytochrome oxidase (CO)-stained 80 micron-thick section of remainder tissue registered to the intact remainder tissue, with barrel field traced to confirm the correct punch localization (gray overlay). (g) Estimated barrel column positions within embedded tissue punch (yellow outlines) based on vascular and tissue paint features (cf. red traced blood vessels in panel f) with estimate of optimal cross-section through the C1 and C2 barrel columns parallel to the C-row axis (dashed cyan line). (h) Portion of ATomo ribbon imaged for DAPI at 10x magnification. (i) Maximum-intensity z-projection (MIP) of volume reconstruction of 25x magnification images of ribbon in h. Left: DAPI (gray). Right: DAPI (gray) and YFP (green). High-resolution imaging is targeted to C1 & C2, L3-L5a (red outlines). (j) MIP of multi-session volume reconstruction of 63x magnification images of region shown in (i), with YFP (grey) vGluT1 (green) and vGluT2 (red).
Figure 3
Figure 3. Validation of synaptic antibody colocalization.
(ac) Multi-channel composite images of related synaptic protein stains in a subregion of a single serial section of the Ex10-R55 ribbon. Scale bar 5 um. (dg) 2-dimensional cross-correlation analysis of the colocalization of antibody stains specific to the pre- and postsynaptic compartments of glutamatergic and GABAergic synapses. Each plot contains an array of panels representing correlation between different stains of a subregion of the Ex10-R55 ribbon as a function of spatial shifts in x and y (shifts up to 10 px shown), averaged over stacks of 10 serial sections. (a,d) Colocalization of stains for presynaptic glutamatergic proteins (Synapsin1, vGluT1 and vGluT2) and comparison with postsynaptic PSD95 and nuclear DAPI stains. (b,e) Colocalization of stains for postsynaptic glutamatergic proteins (PSD95, GluR1, GluR2, NR2A and NR2B) and comparison to nuclear DAPI stain. (c,f) Colocalization of stains for presynaptic (Synapsin1, vGAT, GAD, and PV25) and postsynaptic (GABAARa1 and Gephyrin) GABAergic proteins and comparison with nuclear DAPI stain. (g) Colocalization of glutamatergic and GABAergic vesicular neurotransmitter transporters (vGluT1, vGluT2, vGAT) relative to presynaptic marker Synapsin1, postsynaptic markers PSD95 (glutamatergic) and gephyrin (GABAergic), and DAPI-stained cell nuclei.
Figure 4
Figure 4. Evaluation of stain robustness across imaging sessions.
(a) False-color composite image comparing the first stain of a subregion of ribbon Ex1-R02A with an antibody against Synapsin1 protein (green) with the third sequential stain of the same region (red). Areas of overlap (yellow) represent consistent patterns of staining despite intervening rounds of stripping and restaining. (b) Here the image of the third round of staining has been rotated 180° to illustrate that the chance occurrence of overlapping staining is quite low, despite the high stain density in the two images. (c1) Synapsin1 immunofluorescence intensity at individual pixels compared between rounds 1 and 3. The R value represents Pearson’s correlation coefficient between the two images. An approximate threshold between foreground and background pixels (set at 1,000 a.u.) in each image is illustrated by horizontal and vertical red dashed lines. (c2) The same analysis with the image of round 3 rotated 180° to serve as a control for random colocalizations. (d,e) The same analyses for PSD95 and Gephyrin staining. (f) Comparison of correlation coeffients (R) for images of the first and third round of staining for 15 different antibodies. (g) For the same set of antibody stains, comparison of the ‘percent consistency’: the percent of pixels that were bright (above threshold) in either imaging session which were also bright in the other imaging session. See Table 10 for a full list of these values.
Figure 5
Figure 5. Molecular architecture of glutamatergic and GABAergic synapses.
This figure presents the synaptic organization of the molecules used in the above experiments in cartoon form for glutamatergic (a) and GABAergic (b) synapses. Presynaptic axonal boutons are at the top for both synapses classes, and postsynaptic targets (here a dendritic spine and the surface of a cell body, as is typical of glutamatergic and GABAergic synapses, respectively). Molecules or structures not explicitly stained for in the above experiments are labeled with parentheses. Please see Usage Notes: Choice of Antibodies to Screen for Plasticity among Diverse Synapse Subpopulations, above, for further descriptions and references relevant to this figure.
Figure 6
Figure 6. Quantification of vGluT2 staining in L4 and L5a.
(a) Maximum intensity projection of the C2-L4 ROI of ribbon Ex10-R55 stained for vGluT2 (green) and DAPI (blue). (b) The same for the C2-L5a ROI. (c) Maximum intensity projection of the C2-L4 ROI of ribbon Ex10-R55 stained for Synapsin1 (red). Neuropil volume in each ROI is estimated by using a geometric expansion of the Synapsin1 channel’s negative space (blue), as this antibody is strongly excluded from cell bodies. The adjusted volume is used to calculate neuropil puncta densities for comparison between ROIs. (d) Neuropil-normalized vGluT2 puncta densities across all Chessboard Dataset data volumes for L4 ROIs (left) and L5a ROIs (right), with spared and deprived ROIs within each layer averaged together. vGluT2 density in L5a was significantly less than in L4: median difference: 46.24%; P=0.0313 (Wilcoxon signed-rank nonparametric test for difference of group medians); n=7 ribbons. (e) vGluT2 punctum intensity distributions for ribbon Ex10-R55 ROI C2-L4 (median 25,923 a.u.; n=24,189 puncta) and C2-L5a (median 24,454 a.u.; n=14,888 puncta). Shown are median values (red horizontal line), comparison interval (notch in box plot), interquartile range (vertical box extent), and maximum and minimum values (whiskers). Population medians are significantly different: P=4.85*10−21 (Wilcoxon signed-rank nonparametric test for difference of group medians). (f) Median punctum intensity across all ribbons for L4 ROIs (left) and L5a ROIs (right), with spared and deprived ROIS within each layer averaged together. Median vGluT2 punctum total intensity in L5a was significantly less than in L4: median difference: 21.56%; P=0.0156 (Wilcoxon signed-rank nonparametric test for difference of group medians); n=7 ribbons.

Comment in

  • Ctrl alt share.
    [No authors listed] [No authors listed] Sci Data. 2015 Feb 17;2:150004. doi: 10.1038/sdata.2015.4. eCollection 2015. Sci Data. 2015. PMID: 25977811 Free PMC article. No abstract available.

References

Data Citations

    1. Weiler N. C., Collman F., Vogelstein J. T., Burns R., Smith S. J. 2014. Figshare. http://dx.doi.org/10.6084/m9.figshare.1136081 - DOI - PMC - PubMed
    1. Weiler N. C. 2014. Figshare. http://dx.doi.org/10.6084/m9.figshare.1183512 - DOI

References

    1. Takamori S. et al. Molecular anatomy of a trafficking organelle. Cell 127, 831–846 (2006). - PubMed
    1. McPherson P. S. Proteomic analysis of clathrin-coated vesicles. Proteomics 10, 4025–4039 (2010). - PubMed
    1. Sugiyama Y., Kawabata I., Sobue K. & Okabe S. Determination of absolute protein numbers in single synapses by a GFP-based calibration technique. Nat. Methods 2, 677–684 (2005). - PubMed
    1. Collins M. O. et al. Molecular characterization and comparison of the components and multiprotein complexes in the postsynaptic proteome. J. Neurochem. 97(Suppl 1), 16–23 (2006). - PubMed
    1. Dosemeci A. et al. Composition of the synaptic PSD-95 complex. Mol. Cell. Proteomics 6, 1749–1760 (2007). - PMC - PubMed

Publication types

LinkOut - more resources