

Age and Gender Variations in Cancer Diagnostic Intervals in 15 Cancers: Analysis of Data from the UK Clinical Practice Research Datalink
- PMID: 25978414
- PMCID: PMC4433335
- DOI: 10.1371/journal.pone.0127717
Age and Gender Variations in Cancer Diagnostic Intervals in 15 Cancers: Analysis of Data from the UK Clinical Practice Research Datalink
Abstract
Background: Time from symptomatic presentation to cancer diagnosis (diagnostic interval) is an important, and modifiable, part of the patient's cancer pathway, and can be affected by various factors such as age, gender and type of presenting symptoms. The aim of this study was to quantify the relationships of diagnostic interval with these variables in 15 cancers diagnosed between 2007 and 2010 using routinely collected data from the Clinical Practice Research Datalink (CPRD) in the UK.
Methods: Symptom lists for each cancer were prepared from the literature and by consensus amongst the clinician researchers, which were then categorised into either NICE qualifying (NICE) or not (non-NICE) based on NICE Urgent Referral Guidelines for Suspected Cancer criteria. Multivariable linear regression models were fitted to examine the relationship between diagnostic interval (outcome) and the predictors: age, gender and symptom type.
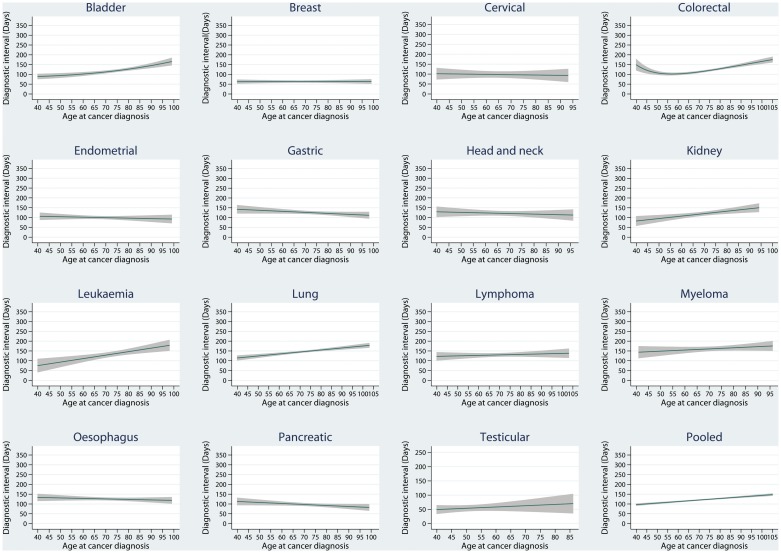
Results: 18,618 newly diagnosed cancer patients aged ≥40 who had a recorded symptom in the preceding year were included in the analysis. Mean diagnostic interval was greater for older patients in four disease sites (difference in days per 10 year increase in age; 95% CI): bladder (10.3; 5.5 to 15.1; P<0.001), kidney (11.0; 3.4 to 18.6; P=0.004), leukaemia (18.5; 8.8 to 28.1; P<0.001) and lung (10.1; 6.7 to 13.4; P<0.001). There was also evidence of longer diagnostic interval in older patients with colorectal cancer (P<0.001). However, we found that mean diagnostic interval was shorter with increasing age in two cancers: gastric (-5.9; -11.7 to -0.2; P=0.04) and pancreatic (-6.0; -11.2 to -0.7; P=0.03). Diagnostic interval was longer for females in six of the gender non-specific cancers (mean difference in days; 95% CI): bladder (12.2; 0.8 to 23.6; P=0.04), colorectal (10.4; 4.3 to 16.5; P=0.001), gastric (14.3; 1.1 to 27.6; P=0.03), head and neck (31.3; 6.2 to 56.5; P=0.02), lung (8.0; 1.2 to 14.9; P=0.02), and lymphoma (19.2; 3.8 to 34.7; P=0.01). Evidence of longer diagnostic interval was found for patients presenting with non-NICE symptoms in 10 of 15 cancers (mean difference in days; 95% CI): bladder (62.9; 48.7 to 77.2; P<0.001), breast (115.1; 105.9 to 124.3; P<0.001), cervical (60.3; 31.6 to 89.0; P<0.001), colorectal (25.8; 19.6 to 31.9; P<0.001), gastric (24.1; 3.4 to 44.8; P=0.02), kidney (22.1; 4.5 to 39.7; P=0.01), oesophageal (67.0; 42.1 to 92.0; P<0.001), pancreatic (48.6; 28.1 to 69.1; P<0.001), testicular (36.7; 17.0 to 56.4; P< 0.001), and endometrial (73.8; 60.3 to 87.3; P<0.001). Pooled analysis across all cancers demonstrated highly significant evidence of differences overall showing longer diagnostic intervals with increasing age (7.8 days; 6.4 to 9.1; P<0.001); for females (8.9 days; 5.5 to 12.2; P<0.001); and in non-NICE symptoms (27.7 days; 23.9 to 31.5; P<0.001).
Conclusions: We found age and gender-specific inequalities in time to diagnosis for some but not all cancer sites studied. Whilst these need further explanation, these findings can inform the development and evaluation of interventions intended to achieve timely diagnosis and improved cancer outcomes, such as to provide equity across all age and gender groupings.
Conflict of interest statement
Figures
References
-
- Department of Health. Improving outcomes: a strategy for cancer. Second Annual Report 2012. London 2012 [cited 23rd April 2015]; Available from: https://www.gov.uk/government/uploads/system/uploads/attachment_data/fil....
-
- Pancreatic Cancer UK. Study for survival 2011. 2011 [cited 23rd April 2015]; Available from: http://www.pancreaticcancer.org.uk/media/86664/study-for-surivial-report....
-
- Rarer Cancer Foundation. Primary cause? An audit of the experience in primary care of rarer cancer patients. UK 2011 [updated 31-01-2014; cited 23rd April 2015]; Available from: http://www.rarercancers.org/images/stories/cdf/p8and9/primary%20cause%20....
-
- Neal R. Do diagnostic delays in cancer matter? Br J Cancer. 2009;101(Suppl 2):S9–S12. doi: 10.1038/sj.bjc.6605384 - DOI - PMC - PubMed
-
- Tørring ML, Frydenberg M, Hansen RP, Olesen F, Hamilton W, Vedsted P. Time to diagnosis and mortality in colorectal cancer: a cohort study in primary care. Br J Cancer. 2011;104:934–940. doi: 10.1038/bjc.2011.60 - DOI - PMC - PubMed
Publication types
MeSH terms
LinkOut - more resources
Full Text Sources
Other Literature Sources
