. 2015 May 15;10(5):e0126022.
doi: 10.1371/journal.pone.0126022. eCollection 2015.

Identification of a 6-cytokine prognostic signature in patients with primary glioblastoma harboring M2 microglia/macrophage phenotype relevance

Affiliations

Identification of a 6-cytokine prognostic signature in patients with primary glioblastoma harboring M2 microglia/macrophage phenotype relevance

Jinquan Cai et al. PLoS One. .

Abstract

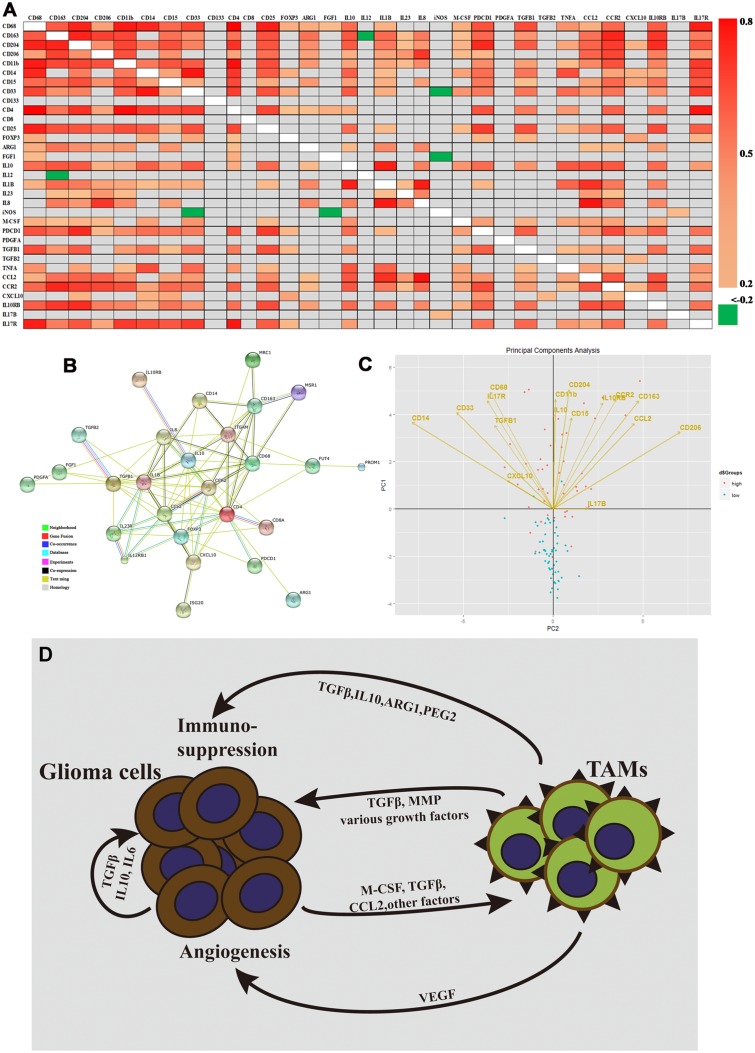
Background: Glioblastomas (GBM) are comprised of a heterogeneous population of tumor cells, immune cells, and extracellular matrix. Interactions among these different cell types and pro-/anti-inflammatory cytokines may promote tumor development and progression.

Aims: The objective of this study was to develop a cytokine-related gene signature to improve outcome prediction for patients with primary GBM.

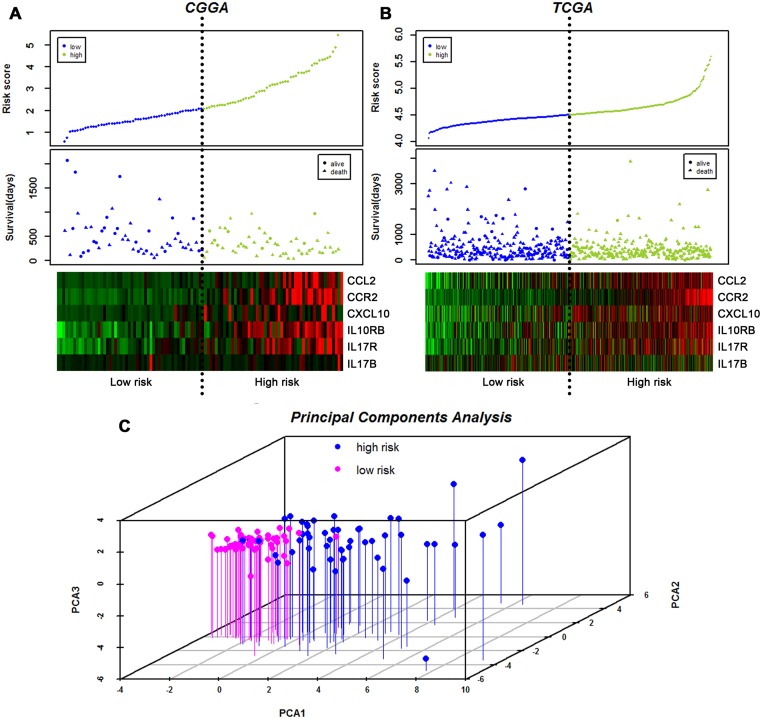
Methods: Here, we used Cox regression and risk-score analysis to develop a cytokine-related gene signature in primary GBMs from the whole transcriptome sequencing profile of the Chinese Glioma Genome Atlas (CGGA) database (n=105). We also examined differences in immune cell phenotype and immune factor expression between the high-risk and low-risk groups.

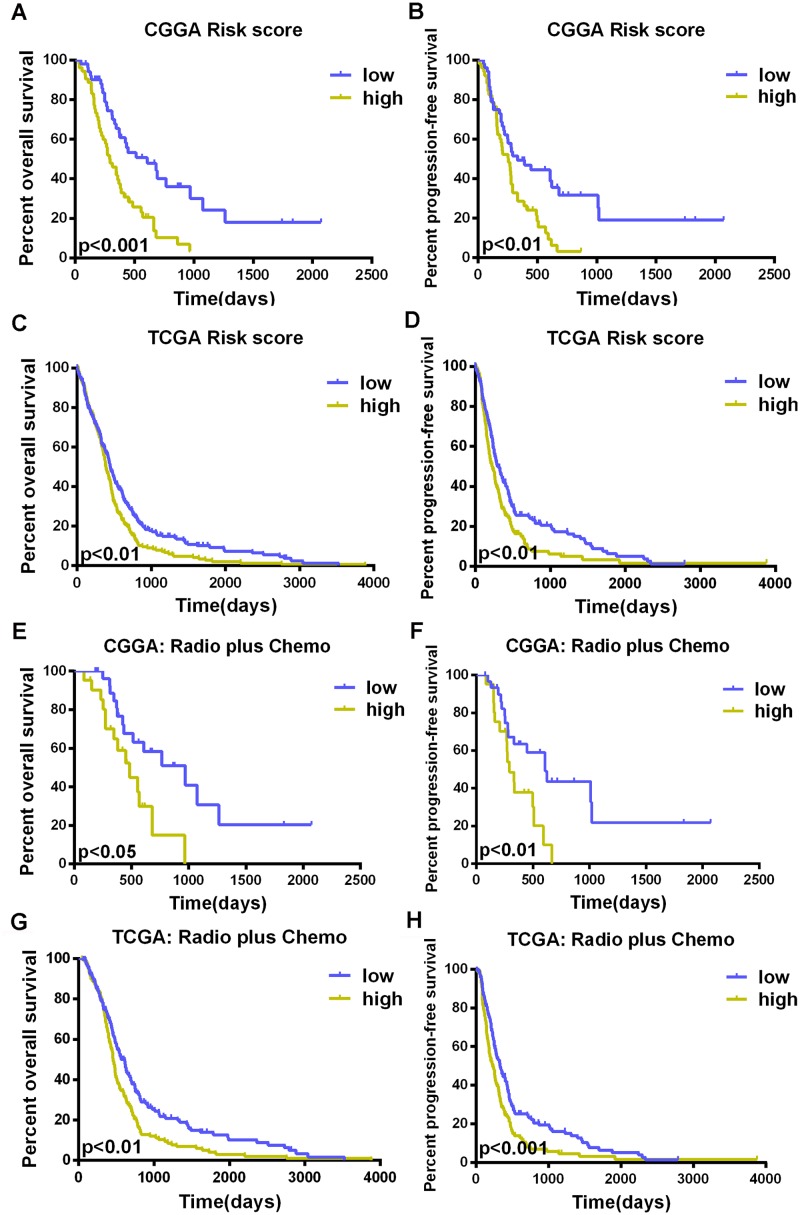
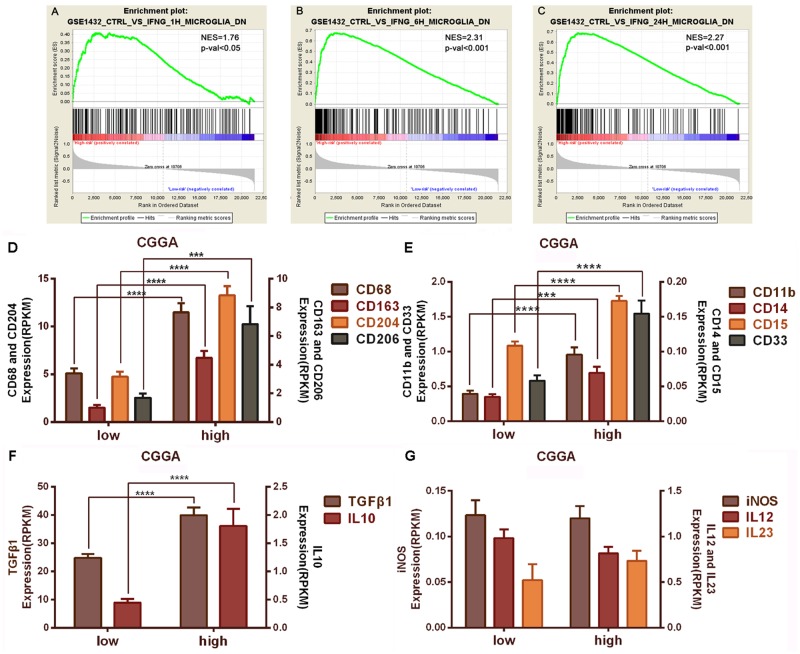
Results: Cytokine-related genes were ranked based on their ability to predict survival in the CGGA database. The six genes showing the strongest predictive value were CXCL10, IL17R, CCR2, IL17B, IL10RB, and CCL2. Patients with a high-risk score had poor overall survival and progression-free survival. Additionally, the high-risk group was characterized by increased mRNA expression of M2 microglia/macrophage markers and elevated levels of IL10 and TGFβ1.

Conclusion: The six cytokine-related gene signature is sufficient to predict survival and to identify a subgroup of primary GBM exhibiting the M2 cell phenotype.


Conflict of interest statement

Competing Interests: The authors have declared that no competing interests exist.

Figures

Fig 1
Fig 1. Development of the prognostic model.
Kaplan—Meier curves for overall and progression-free survivals in the two groups (low risk and high risk) as defined by a prediction model based on the weighted expression of six genes (CCL2, CCR2, CXCL10, IL10RB, IL17B, and IL17R) (A, B). This Kaplan-Meier assessment of OS and PFS in patients with glioblastoma illustrates a risk score analysis using this signature in the TCGA cohort (C, D). The risk score has prognostic value of survival in the radiotherapy plus temozolomide group from both the CGGA and TCGA datasets (E, F, G, H).
Fig 2
Fig 2. Distribution of risk scores and patient survival duration.
Analysis of risk scores, OS, and mRNA expression in the CGGA cohort (A) and the TCGA cohort (B), including (Top) signature risk score distribution and (Middle) patient survival status and duration. A heat map showing expression of the six genes in both the high-risk and low-risk groups (Bottom); rows represent corresponding genes, and columns indicate corresponding patients. The black dotted lines in the middle of each graph (A, B) represent the gene signature cutoff (median risk score). Principal component analyses (C) of the CGGA dataset using the six genes. Graph of the first 3 principal components shows excellent separation between low-risk (pink) and high-risk (blue) groups. PCA1, PCA2, and PCA3 represent the top three dimensions of genes showing differential expression among these preimplantation blastomeres, which account for 41.2%, 17.6%, and 15.6% of the expressed genes, respectively.
Fig 3
Fig 3. Assessment of gene expression between the high and low subgroups.
The enrichment plots of the immunologic gene expression signatures of activated microglia are separated into high- and low-risk score groups. A, NES = 1.76, p-val<0.05; B, NES = 2.31, p-val<0.001; C, NES = 2.27, p-val<0.001. NES refers to Normalized Enrichment Score; p-val refers to FWER p value. M2 microglia/macrophage markers (CD68, CD163, CD204, and CD206) were significantly up-regulated in the high-risk group (D). MDSC markers (CD11b, CD14, CD15, and CD33) showed increased expression in the high-risk group (E). Genes encoding TGFβ1 and IL10 are expressed at higher levels in the high-risk group (F). M1 markers (iNOS and IL12) are not significantly different between the low-risk group and the high-risk group (G). *, P<0.05; **, P<0.01; ***, P<0.001.
Fig 4
Fig 4. Expression patterns of cell markers and immunomodulatory genes, and Model of M2 microglia/macrophage production in GBM.
(A) Heat map representation of statistically significant differentially expressed genes (P<0.05). Spearman correlation was performed between the expression levels of the indicated gene pairs in the cohort (Spearman coefficients are shown as colors corresponding to the scale bar). Gray represents gene combinations without significant correlation. (B) Protein interaction subnetwork based on protein-coding genes and their interacting partners. Nodes represent protein coding genes; links represent physical interactions. Nodes in color indicate enriched biological functions of the proteins. A red line is indicative of fusion; green line—neighborhood evidence; blue line—co-occurrence evidence; purple line—experimental evidence; yellow line—text mining evidence; light blue line—database evidence; black line—co-expression evidence. mRNA expression of genes from (C) were used for PCA analysis, which is represented by 2-dimensional visualization. The symbols represent independent patient data (blue—low risk group; pink—high risk group). PCA projections of the first 2 principal components are shown. Arrows represent individual genes with the points directed at their loading coordinates. (D) Tumor-derived molecules, such as TGFβ and M-CSF, can polarize glioma-associated microglia/microphages (MMs) toward the M2 phenotype and stimulate the production of anti-inflammatory molecules. Other glioma-derived molecules, such as CCL2 and VEGF, can recruit myeloid cells into the tumor site. TAMs refer to tumor-associated microglia/macrophages.

References

    1. Olar A, Aldape KD. Using the molecular classification of glioblastoma to inform personalized treatment. The Journal of pathology. 2014;232(2):165–77. 10.1002/path.4282 . - DOI - PMC - PubMed
    1. Ohgaki H, Kleihues P. Epidemiology and etiology of gliomas. Acta Neuropathol. 2005;109(1):93–108. 10.1007/s00401-005-0991-y . - DOI - PubMed
    1. Louis DN, Ohgaki H, Wiestler OD, Cavenee WK, Burger PC, Jouvet A, et al. The 2007 WHO classification of tumours of the central nervous system. Acta Neuropathologica. 2007;114(2):97–109. 10.1007/s00401-007-0243-4 WOS:000248046800001. - DOI - PMC - PubMed
    1. Kanu OO, Mehta A, Di C, Lin N, Bortoff K, Bigner DD, et al. Glioblastoma multiforme: a review of therapeutic targets. Expert opinion on therapeutic targets. 2009;13(6):701–18. 10.1517/14728220902942348 . - DOI - PubMed
    1. Glass R, Synowitz M. CNS macrophages and peripheral myeloid cells in brain tumours. Acta Neuropathol. 2014. 10.1007/s00401-014-1274-2 . - DOI - PubMed

Publication types

MeSH terms