. 2015 Jul 1:82:55-63.
doi: 10.1016/j.ymeth.2015.05.008. Epub 2015 May 13.

Methods for discovery and characterization of cell subsets in high dimensional mass cytometry data

Affiliations

Methods for discovery and characterization of cell subsets in high dimensional mass cytometry data

Kirsten E Diggins et al. Methods. .

Abstract

The flood of high-dimensional data resulting from mass cytometry experiments that measure more than 40 features of individual cells has stimulated creation of new single cell computational biology tools. These tools draw on advances in the field of machine learning to capture multi-parametric relationships and reveal cells that are easily overlooked in traditional analysis. Here, we introduce a workflow for high dimensional mass cytometry data that emphasizes unsupervised approaches and visualizes data in both single cell and population level views. This workflow includes three central components that are common across mass cytometry analysis approaches: (1) distinguishing initial populations, (2) revealing cell subsets, and (3) characterizing subset features. In the implementation described here, viSNE, SPADE, and heatmaps were used sequentially to comprehensively characterize and compare healthy and malignant human tissue samples. The use of multiple methods helps provide a comprehensive view of results, and the largely unsupervised workflow facilitates automation and helps researchers avoid missing cell populations with unusual or unexpected phenotypes. Together, these methods develop a framework for future machine learning of cell identity.

Keywords: Flow cytometry; Machine learning; Mass cytometry; Single cell biology; Unsupervised analysis.


Conflict of interest statement

Conflicts of Interest: JMI has a financial interest as co-founder and board member in Cytobank Inc., a software company for single cell data analysis. No other conflicts.

Figures

Fig. 1
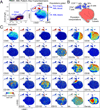
Fig. 1. Distinguishing initial populations with viSNE analysis of per-cell protein expression and expert gating
Plots show the use of viSNE to obtain a comprehensive single cell view and to initially distinguish cancerous and non-malignant cells in the blood of an AML patient. A) Expert analysis of mass cytometry data identified intact single cells using event length and intercalator uptake. Subsequent viSNE analysis arranged cells along unitless t-SNE axes according to per-cell expression of 27 proteins. Expression of CD45 protein is shown for each cell on a heat scale. viSNE automatically arranged leukemia cells in one area of the map and facilitated selection of AML blast and non-blast cells by expert gating. Populations identified by viSNE and expert gating were subsequently analyzed by SPADE (Fig. 2). B) Human interpretation of population identities based on viSNE analysis is shown. C) Plots show expression of the 27 proteins, nucleic acid intercalator (NA), and density measured per cell.
Figure 2
Figure 2. Revealing cell subsets with SPADE analysis of population hierarchy, cell abundance, and median protein expression
Plots show the use of SPADE to reveal clusters of cell subsets in cell populations identified by expert analysis and viSNE (Fig. 1). A) SPADE analysis identified distinct population clusters in each sample. Cell abundance is represented by size and color of each circle representing a population of cells. Phenotypically distinct cell subsets fell into different regions of the SPADE tree. B) Human interpretation of population identities based on SPADE analysis is shown. C) Plots show expression of the 27 proteins, nucleic acid interalator (NA), and density measured per cell.
Figure 3
Figure 3. Characterizing cell subsets with a heatmap analysis of median protein expression and hierarchical clustering of proteins and populations
A heatmap shows characterization of cell populations identified by SPADE (columns) according to median expression of 27 proteins (rows). For each sample analyzed in Fig. 2, cell populations identified by SPADE that contained at least 1% of total cells were included. Cell populations and proteins were arranged according to complete linkage hierarchical clustering. Heat intensity reflects the median expression of each protein for each cell population. B) Each population contained cells from only the indicated source (healthy marrow, non-malignant cells in AML patient blood, and AML blasts). Human interpretation of population identities based on clustered heatmap analysis is shown.

References

    1. Irish JM, Doxie DB. Current topics in microbiology and immunology. 2014;377:1–21. - PMC - PubMed
    1. Bandura DR, Baranov VI, Ornatsky OI, Antonov A, Kinach R, Lou X, Pavlov S, Vorobiev S, Dick JE, Tanner SD. Analytical chemistry. 2009;81:6813–6822. - PubMed
    1. Ornatsky O, Bandura D, Baranov V, Nitz M, Winnik MA, Tanner S. Journal of immunological methods. 2010;361:1–20. - PubMed
    1. Finak G, Frelinger J, Jiang W, Newell EW, Ramey J, Davis MM, Kalams SA, De Rosa SC, Gottardo R. PLoS computational biology. 2014;10:e1003806. - PMC - PubMed
    1. Aghaeepour N, Finak G, Flow CAPC, Consortium D, Hoos H, Mosmann TR, Brinkman R, Gottardo R, Scheuermann RH. Nature methods. 2013;10:228–238.

Publication types