. 2015 May 19;42(5):942-52.
doi: 10.1016/j.immuni.2015.04.011. Epub 2015 May 12.

The Autoimmunity-Associated Gene CLEC16A Modulates Thymic Epithelial Cell Autophagy and Alters T Cell Selection

Affiliations

The Autoimmunity-Associated Gene CLEC16A Modulates Thymic Epithelial Cell Autophagy and Alters T Cell Selection

Cornelia Schuster et al. Immunity. .

Abstract

CLEC16A variation has been associated with multiple immune-mediated diseases, including type 1 diabetes, multiple sclerosis, systemic lupus erythematosus, celiac disease, Crohn's disease, Addison's disease, primary biliary cirrhosis, rheumatoid arthritis, juvenile idiopathic arthritis, and alopecia areata. Despite strong genetic evidence implicating CLEC16A in autoimmunity, this gene's broad association with disease remains unexplained. We generated Clec16a knock-down (KD) mice in the nonobese diabetic (NOD) model for type 1 diabetes and found that Clec16a silencing protected against autoimmunity. Disease protection was attributable to T cell hyporeactivity, which was secondary to changes in thymic epithelial cell (TEC) stimuli that drive thymocyte selection. Our data indicate that T cell selection and reactivity were impacted by Clec16a variation in thymic epithelium owing to Clec16a's role in TEC autophagy. These findings provide a functional link between human CLEC16A variation and the immune dysregulation that underlies the risk of autoimmunity.


Figures

Figure 1
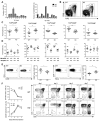
Figure 1. Clec16a KD prevents autoimmunity by reducing the pathogenicity of T cells
(A) Spontaneous diabetes frequency in cohorts of WT (n = 50) and Clec16a KD (KD, n = 42) NOD mice, P < 0.0001. (B) Insulitis in WT and KD mice at 4, 6, 8 and 10 weeks of age. n = 2-5 mice (150-500 islets) per group. Islets were scored as free of insulitis, or as having moderate or severe infiltration, as shown in representative images. (C) Cyclophosphamide (CY) diabetes in WT (n = 10) and KD (n = 13) mice, P = 0.0035. (D) CY diabetes in NOD.SCID mice reconstituted with WT (n = 16) or KD (n = 18) splenocytes, P = 0.0002. (E) Diabetes frequency in WT NOD.SCID (n = 13) or Clec16a KD NOD.SCID (n = 14) mice reconstituted with WT splenocytes, P = 0.36. (F) CY diabetes in NOD.SCID mice reconstituted with T and B cells, respectively, in the following combinations: WT/WT (n = 7), WT/KD (n = 5), KD/WT (n = 5), KD/KD (n = 4), P = 0.0046 for WT T cell groups vs. KD T cell groups using Fisher's exact test.
Figure 2
Figure 2. Clec16a KD causes T cell hyporeactivity
(A, B) Proliferation of CD4 T cells in response to CD3 antibody (A, left panel), CD3/CD28 antibody-coated beads (A, right panel) or PMA and ionomycin (B). (C) Western blot measurements of ZAP-70, PLC-γ and ERK1/2 phosphorylation in WT or KD CD4 T cells stimulated with cross-linked CD3 antibody for the indicated length of time (in min). (D) Proliferation of WT or KD TCR transgenic BDC2.5 CD4 T cells in response to BDC2.5 mimotope peptide (left panel), CD3 antibody (1 μg/ml, middle panel) or PMA and ionomycin (right panel). (E) Suppression of WT CD4 T cell proliferation by WT or KD CD4+CD25+ Treg cells. Results show mean ± SEM of triplicate measurements and are representative of 2 to 4 experiments. ** P < 0.01 See also Figure S2.
Figure 3
Figure 3. The effect of Clec16a silencing is not T cell-intrinsic
(A) Proliferation of GFP+ and GFP- Clec16a KD and WT CD4+ T cells stimulated with anti-CD3 antibody. (B) Proliferation of FACS-sorted CD4+ T cells from WT or KD mice (left panel) or from WT bone-marrow (BM) chimeric mice reconstituted with WT or KD BM (right panel) stimulated with anti-CD3/anti-CD28 coated beads. (C) CY diabetes in WT BM chimeric mice reconstituted with WT (n = 6) or KD (n = 4) BM. (D) CY diabetes in Clec16a KD BM chimeric mice reconstituted with WT (n = 10) or KD (n = 10) BM, P = 0.14. (E) Diabetes frequency in NOD mice thymectomized at 4 weeks of age and subsequently transplanted with fetal thymus (E14) from Clec16a KD (KD3 n = 10, KD5 n = 10) or WT (n= 7) embryos in conjunction with WT bone-marrow after irradiation, WT vs. KD - P = 0.0132. No difference was observed in either the size of thymuses post-transplantation or the frequency of T cells in transplanted mice at the time of diabetes onset (data not shown).
Figure 4
Figure 4. Clec16a KD modifies the reactivity of CD4SP but not DP thymocytes
(A) CD25 up-regulation (left) and proliferation (right) of WT or KD CD4SP cells stimulated in vitro. (B) Frequency of DP cells in the thymus of WT or KD mice 48 h after injection with CD3 antibody. Results are representative of 3 experiments. * P < 0.05, *** P < 0.001. See also Figure S4.
Figure 5
Figure 5. Clec16a silencing impacts thymic selection
(A) Frequency of DP or CD4SPCD25- thymocytes that express different TCR Vβ chains in the thymus of WT (filled bars, n = 6) or KD3 (open bars, n = 6) mice. Vβ5 antibody recognizes both Vβ 5.1 and Vβ 5.2. Vβ8 antibody recognizes both Vβ8.1 and Vβ8.2. (B, C) Representative flow cytometry data (B) and frequency (C) of thymocyte populations distinguished by TCR and CD69 expression in WT (n = 12) and KD (n = 12) mice. (D) Frequency of thymocyte populations as in (C) measured in irradiated WT or KD mice reconstituted with WT or KD bone-marrow (BM) 6 weeks after reconstitution (n = 6-8 mice per group). (E) Representative flow cytometry data and frequency of CD69+ or Helios+ cells within the CD4SP population in WT (n = 9) or KD (n = 9) mice. (F) Representative flow cytometry data and frequency of BrdU-labeled thymocytes following a single injection of BrdU (n = 3 mice per group for each time point), P = 0.0422 for DP cells and P = 0.0004 for FoxP3-CD4SP cells, two-tailed paired t-test. All data are representative of 2 to 4 experiments. * P < 0.05, ** P < 0.01, ***P < 0.001. See also Figure S5.
Figure 6
Figure 6. Clec16a KD disrupts TEC autophagy
(A) Clec16a expression in WT or KD TECs (pooled from 4 mice/group, triplicate measurements); representative of 2 experiments. (B) Autophagosome quantification in WT or KD thymic cortex (shown) and medulla (not shown) (n = 5 mice/group, autophagosomes were enumerated per area of a fixed but arbitrary size and data were averaged from 5 images/mouse). Representative thymus sections used for quantification are shown. Insets show a magnified area marked by arrows that point to distinct autophagosomes within cells. (C) Quantification of LC3 protein in WT and KD TECs. Results show KD relative to WT and are representative of 2 experiments. (D, E) LC3 and p62 quantification in MJC1 cells transduced with control (ctrl), Clec16a (KD3 and KD5) or Atg5 shRNA. Cells were starved in the presence of the protease inhibitor E64d (D), or in the presence or absence (-) of rapamycin (R) or 3-MA (M) that induces and inhibits autophagy, respectively (E). Data shown in D and E are representative of 3 independent experiments.
Figure 7
Figure 7. Clec16a silencing affects the stimulatory capacity of TECs
(A) Frequency of thymocyte subpopulations distinguished by their relative TCR and CD69 expression 4 h (top panels) and 24 h (bottom panels) after stimulation with control or Clec16a KD MJC1 cells. Input cells were WT immature (TCRloCD69lo) thymocytes; representative of 3 experiments. (B) Frequency of TCRhi OT-II cells 24 h after stimulation of immature OT-II thymocytes with control, Clec16a KD or Atg5 KD MJC1 TECs transduced with OVA323-339-LC3 or OVA323-339-LC3G120A; representative of 4 experiments. * P < 0.05, ** P < 0.01, ***P < 0.001. See also Figure S7.

Similar articles

Cited by

References

    1. Aichinger M, Wu C, Nedjic J, Klein L. Macroautophagy substrates are loaded onto MHC class II of medullary thymic epithelial cells for central tolerance. J Exp Med. 2013;210:287–300. - PMC - PubMed
    1. Anderson MS, Bluestone JA. The NOD mouse: a model of immune dysregulation. Annu Rev Immunol. 2005;23:447–485. - PubMed
    1. Berge T, Leikfoss IS, Harbo HF. From Identification to characterization of the multiple sclerosis susceptibility gene CLEC16A. Int J Mol Sci. 2013;14:4476–4497. - PMC - PubMed
    1. Bjørkøy G, Lamark T, Brech A, Outzen H, Perander M, Overvatn A, Stenmark H, Johansen T. p62/SQSTM1 forms protein aggregates degraded by autophagy and has a protective effect on huntingtin-induced cell death. J Cell Biol. 2005;171:603–614. - PMC - PubMed
    1. Brazil MI, Weiss S, Stockinger B. Excessive degradation of intracellular protein in macrophages prevents presentation in the context of major histocompatibility complex class II molecules. Eur J Immunol. 1997;27:1506–1514. - PubMed

Publication types

MeSH terms

Substances