

A Four-kallikrein Panel Predicts High-grade Cancer on Biopsy: Independent Validation in a Community Cohort
- PMID: 25979570
- PMCID: PMC4643413
- DOI: 10.1016/j.eururo.2015.04.028
A Four-kallikrein Panel Predicts High-grade Cancer on Biopsy: Independent Validation in a Community Cohort
Abstract
Background: A statistical model based on four kallikrein markers (total prostate-specific antigen [tPSA], free PSA [fPSA], intact PSA, and human kallikrein-related peptidase 2) in blood can predict risk of Gleason score ≥7 (high-grade) cancer at prostate biopsy.
Objective: To determine the value of this model in predicting high-grade cancer at biopsy in a community-based setting in which referral criteria included percentage of fPSA to tPSA (%fPSA).
Design, setting, and participants: We evaluated the model, with or without adding blood levels of microseminoprotein-β (MSMB) in a cohort of 749 men referred for prostate biopsy due to elevated PSA (≥3 ng/ml), low %fPSA (<20%), or suspicious digital rectal examination at Skåne University Hospital, Malmö, Sweden.
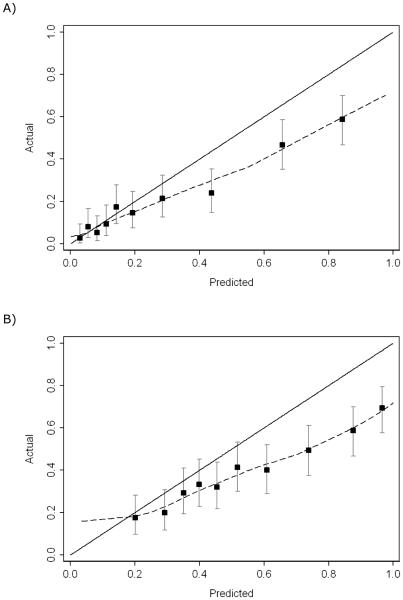
Outcome measurements and statistical analysis: The kallikrein markers, with or without MSMB levels, measured in cryopreserved anticoagulated blood were combined with age in a published statistical model (Prostate Testing for Cancer and Treatment [ProtecT]) to predict high-grade cancer at biopsy. Predictive accuracy was compared with a base model.
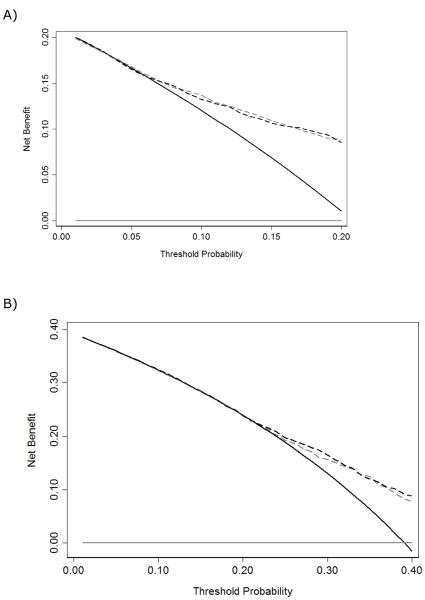
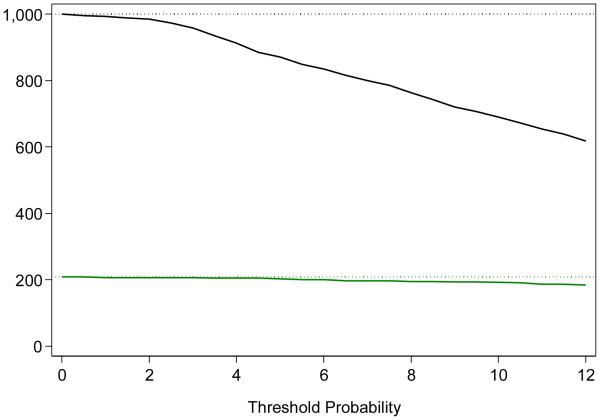
Results and limitations: The %fPSA was low (median: 17; interquartile range: 13-22) in this cohort because this marker was used as a referral criterion. The ProtecT model improved discrimination over age and PSA for high-grade cancer (0.777 vs 0.720; p=0.002). At one illustrative cut point, use of the panel would reduce the number of biopsies by 236 per 1000 and detect 195 of 208 (94%) but delay diagnosis of 13 of 208 high-grade cancers. MSMB levels in blood did not improve the accuracy of the panel (p=0.2).
Conclusions: The kallikrein model is predictive of high-grade cancer if criteria for biopsy referral also include %fPSA, and it can reduce unnecessary biopsies without missing an undue number of tumors.
Patient summary: We evaluated a published model to predict biopsy outcome in men biopsied due to low percentage of free to total prostate-specific antigen. The model helps reduce unnecessary biopsies without missing an undue number of high-grade cancers.
Keywords: Biopsy; Four-kallikrein panel; Prostate cancer; Prostate-specific antigen.
Copyright © 2015 European Association of Urology. Published by Elsevier B.V. All rights reserved.
Figures
References
-
- Lilja H, Ulmert D, Vickers AJ. Prostate-specific antigen and prostate cancer: prediction, detection and monitoring. Nat Rev Cancer. 2008;8:268–78. - PubMed
Publication types
MeSH terms
Substances
Grants and funding
LinkOut - more resources
Full Text Sources
Other Literature Sources
Medical
Molecular Biology Databases
Research Materials
Miscellaneous
