. 2015 Jun 16;84(24):2413-21.
doi: 10.1212/WNL.0000000000001681. Epub 2015 May 15.

CSF proteins and resting-state functional connectivity in Parkinson disease

Affiliations

CSF proteins and resting-state functional connectivity in Parkinson disease

Meghan C Campbell et al. Neurology. .

Abstract

Objective: The purpose of this study was to investigate the relationship between disruption of MRI-measured resting-state functional connectivity (rs-fcMRI) brain networks and CSF levels of potentially pathogenic proteins that reflect brain pathology in Parkinson disease (PD).

Methods: PD participants without dementia (n = 43) and age-matched controls (n = 22) had lumbar punctures to measure CSF protein levels, Pittsburgh compound B (PiB)-PET imaging, and rs-fcMRI while off medication. Imaging analyses focused on 5 major resting-state networks as well as the striatum.

Results: Participants with PD had significantly reduced sensorimotor functional connectivity, which correlated with reduced CSF levels of α-synuclein. The PD group also had significantly stronger default mode network functional connectivity that did not correlate with CSF β-amyloid (Aβ)42 or PiB uptake. In contrast, default mode network functional connectivity in the control group did correlate with CSF Aβ42 levels. Functional connectivity was similar between groups in the dorsal attention, control, and salience networks.

Conclusion: These results suggest that abnormal α-synuclein accumulation, but not Aβ, contributes to the disruption of motor-related functional connectivity in PD. Furthermore, correlating CSF protein measures with the strength of resting-state networks provides a direct link between abnormal α-synuclein metabolism and disrupted brain function in PD.


Figures

Figure 1
Figure 1. RSN and striatal functional connectivity seeds
The expanded RSN seeds for each network are in the top panel of images (A). Colors indicate the respective RSNs as follows: blue = DMN; red = DAN; green = CON; purple = SAL; teal = SMN. See table e-1 for complete list of seed regions. The bottom panel of images (B) shows the striatal seeds of the DC (Talairach: −12.76, 10.83, 11.64, left; 12.04, 10.56, 12.18, right), DCP (−26.89, −2.23, 4.88, left; 26.53, −2.81, 6.05, right), and DRP (−24.12, 4.35, 8.17, left; 23.58, 3.83, 9.21, right). CON = control network; DAN = dorsal attention network; DC = dorsal caudate; DCP = dorsal caudal putamen; DMN = default mode network; DRP = dorsal rostral putamen; RSN = resting-state network; SAL = salience network; SMN = sensorimotor network.
Figure 2
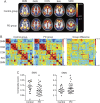
Figure 2. RSN functional connectivity for PD and control groups
Both groups display the typical functional connectivity patterns for each RSN, as shown by the Fisher z(r) correlation maps representing each RSN (A) and network correlation matrices (B). Each network is bound by a different color box, as follows: blue = DMN; red = DAN; green = CON; purple = SAL; teal = SMN. The group difference correlation map represents the control group − PD group. Warm colors represent positive correlations and cool colors represent negative (“anti-correlations”) correlations. (C) Scatterplots demonstrate the significant differences (as indicated by asterisks; p < 0.05) between PD (circles) and control (squares) groups in SMN and DMN functional connectivity. Open symbols indicate outliers. CON = control network; DAN = dorsal attention network; DMN = default mode network; PD = Parkinson disease; RSN = resting-state network; SAL = salience network; SMN = sensorimotor network.
Figure 3
Figure 3. Striatal functional connectivity differences between PD and control groups for the left dorsal caudate
Top 2 rows are the group average Fisher z(r) correlation maps for the left dorsal caudate seed. The bottom row of images (group contrast effect) represent the gaussianized t statistic (z score) thresholded at |z| = 2.0 from the between-group random-effects analysis. Significant group difference clusters are determined by computing threshold-extent criteria using Monte Carlo simulations for multiple comparison correction. Significant group difference clusters in the temporal-parietal junction (z = 3.3, p = 0.05) (A) and cerebellum (z = 2.2, p = 0.05) (B) are circled. Warm colors indicate higher correlations in the control group and cool colors indicate higher correlations in the PD group. PD = Parkinson disease.
Figure 4
Figure 4. CSF protein levels and resting-state network functional connectivity
Top row of figures are the PD group (circles) correlations. CSF α-synuclein significantly correlated with SMN and DAN functional connectivity for the PD group. Bottom row of figures are the control group (squares) correlations. CSF Aβ42 significantly correlated with DMN functional connectivity for the control group (squares). Open symbols indicate outliers. Aβ = β-amyloid; DAN = dorsal attention network; DMN = default mode network; PD = Parkinson disease; SMN = sensorimotor network.

Comment in

References

    1. Kotzbauer PT, Cairns NJ, Campbell MC, et al. Pathologic accumulation of alpha-synuclein and A beta in Parkinson disease patients with dementia. Arch Neurol 2012;69:1326–1331. - PMC - PubMed
    1. Wu T, Wang L, Chen Y, Zhao C, Li K, Chan P. Changes of functional connectivity of the motor network in the resting state in Parkinson's disease. Neurosci Lett 2009;460:6–10. - PubMed
    1. Wu T, Long X, Wang L, et al. Functional connectivity of cortical motor areas in the resting state in Parkinson's disease. Hum Brain Mapp 2011;32:1443–1457. - PMC - PubMed
    1. Helmich RC, Derikx LC, Bakker M, Scheeringa R, Bloem BR, Toni I. Spatial remapping of cortico-striatal connectivity in Parkinson's disease. Cereb Cortex 2010;20:1175–1186. - PubMed
    1. Esposito F, Tessitore A, Giordano A, et al. Rhythm-specific modulation of the sensorimotor network in drug-naive patients with Parkinson's disease by levodopa. Brain 2013;136:710–725. - PubMed

Publication types

MeSH terms