. 2015 May 15;4(7):865-72.
doi: 10.1242/bio.009886.

Asymmetric cell division of granule neuron progenitors in the external granule layer of the mouse cerebellum

Affiliations

Asymmetric cell division of granule neuron progenitors in the external granule layer of the mouse cerebellum

Parthiv Haldipur et al. Biol Open. .

Abstract

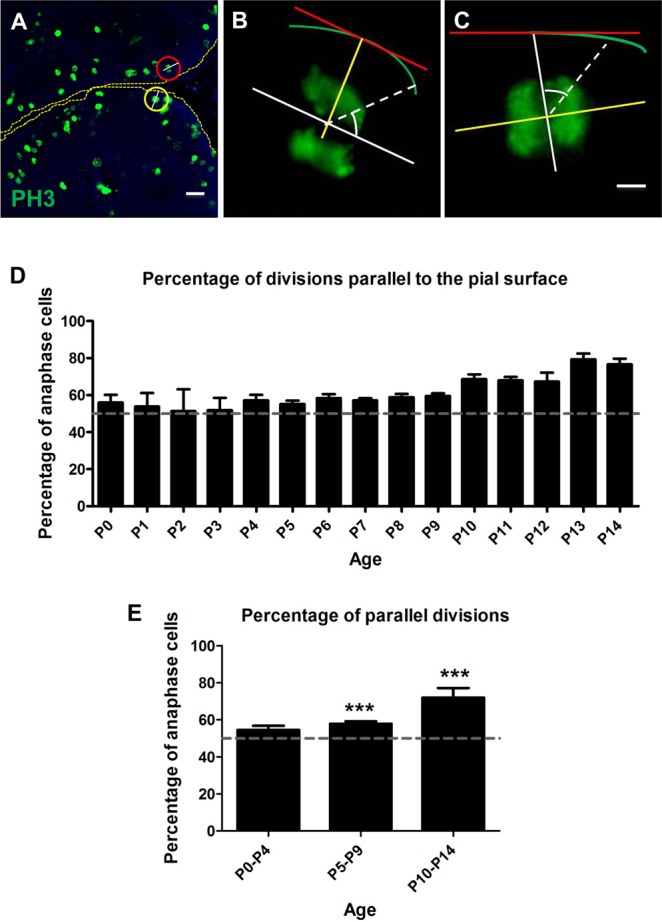
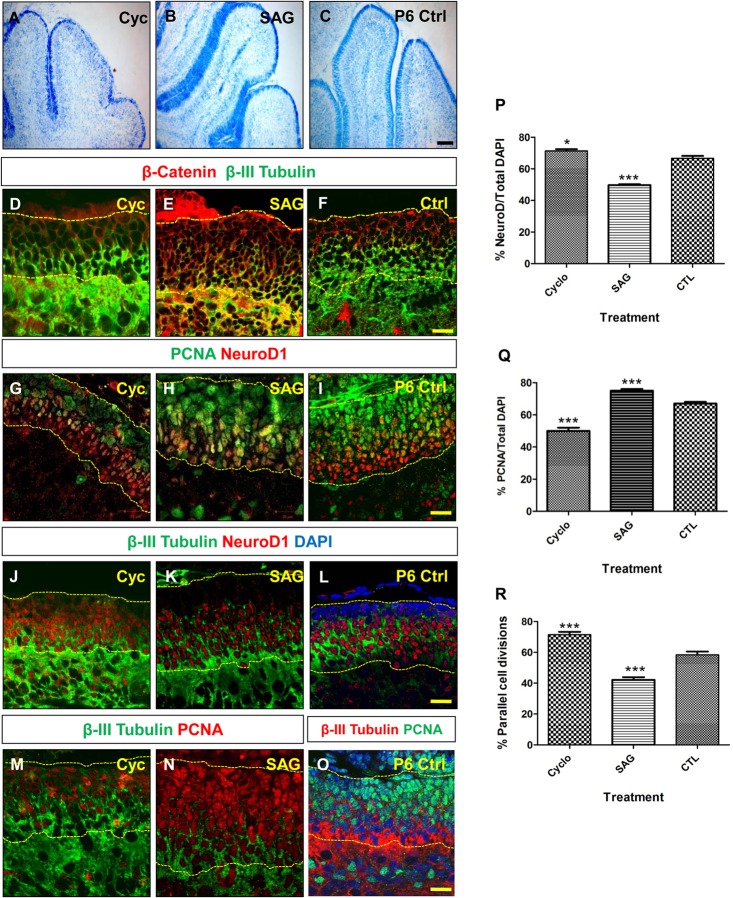
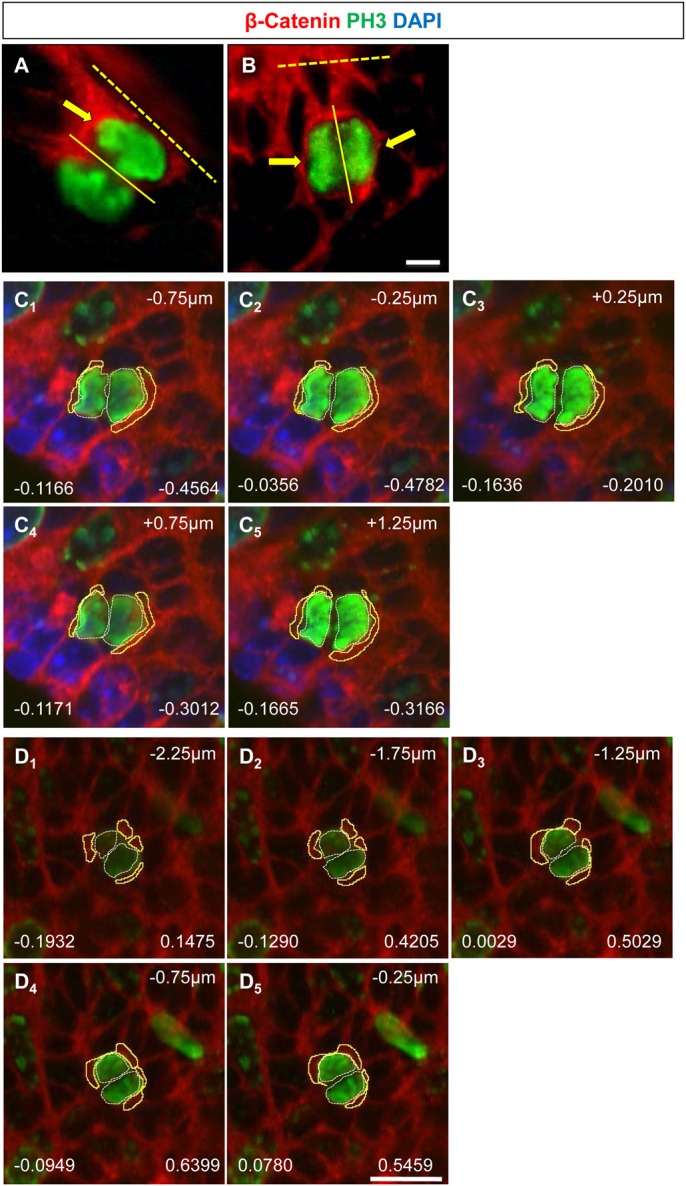
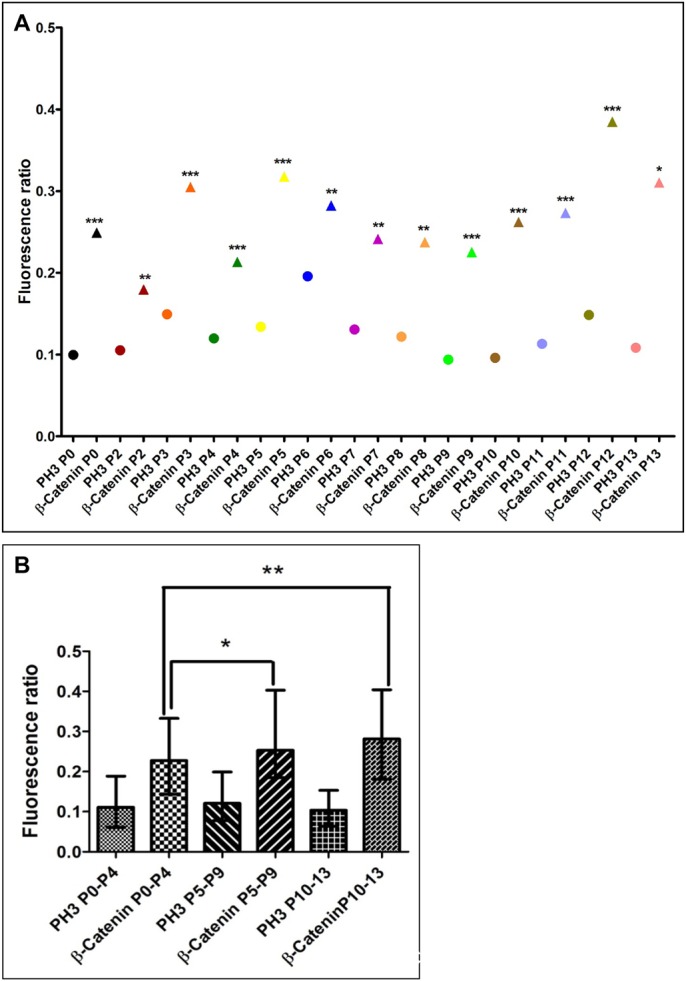
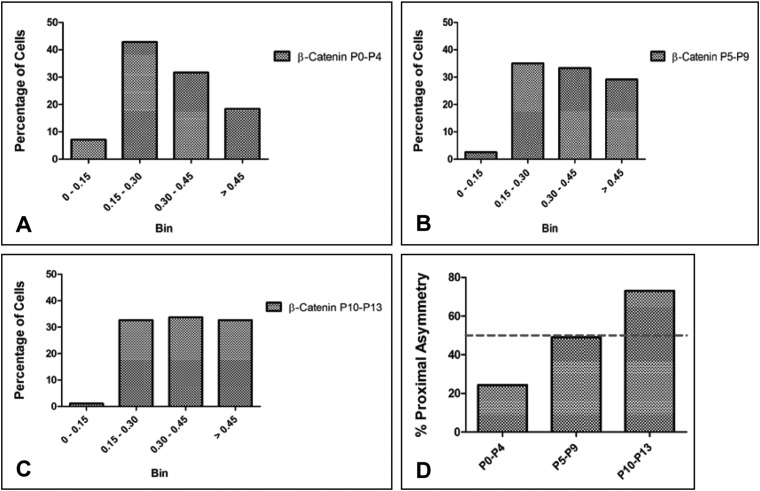
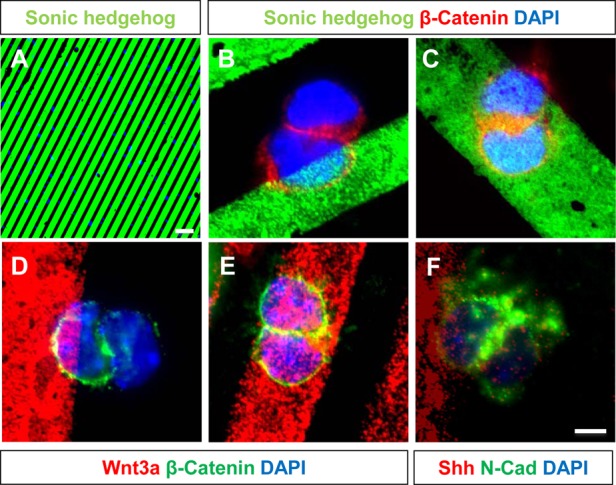
The plane of division of granule neuron progenitors (GNPs) was analysed with respect to the pial surface in P0 to P14 cerebellum and the results showed that there was a significant bias towards the plane of cell division being parallel to pial surface across this developmental window. In addition, the distribution of β-Catenin in anaphase cells was analysed, which showed that there was a significant asymmetry in the distribution of β-Catenin in dividing GNPs. Further, inhibition of Sonic Hedgehog (Shh) signalling had an effect on plane of cell division. Asymmetric distribution of β-Catenin was shown to occur towards the source of a localized extracellular cue.

Keywords: Cell division; Cerebellum; Sonic hedgehog; β-Catenin.


Conflict of interest statement

Competing interests

The authors certify that there is no conflict of interest with any organization regarding the material discussed in the manuscript.

Figures

Fig. 1.
Fig. 1.
The age-wise distribution of cell divisions that are parallel and perpendicular to the plane of the pia. (A) Phosphohistone H3 (PH3) immunohistochemistry (green) on P6 mouse cerebellum. Divisions were classified into parallel (red circle) and perpendicular (yellow circle). (B) Magnified view of a cell whose plane of division (white line) is parallel to the pial surface (red line). (C) Magnified view of a cell whose plane of division (white line) is perpendicular to the pial surface (red line). (D) Weighted mean and standard deviations of percentage of parallel cell divisions plotted for each age. (E) Age-wise grouped weighted mean and standard deviations of percentage of parallel cell divisions. The percentage of parallel divisions increases significantly between P0–P4 and P5–P9 and also between P0–P4 and P10–P14 (***p<0.001); Unpaired two tailed t-test (n>5). The grey line in both graphs is drawn at 50% which would be the percentage of obtaining a parallel division if there was no bias. Error bars in D and E represent standard deviation.
Fig. 2.
Fig. 2.
Perturbation of Shh signalling induces a change in the level of neurogenesis in the cerebellar EGL (A-C) Nissl staining of the Cyclopamine treated (Cyc), SAG treated, and P6 control (Ctrl) animals respectively showing the thickness of the EGL. Scale bar=100 µm. (D-F) β-Catenin and β-III Tubulin immunohistochemistry in Cyclopamine, SAG treated and control animals. (G-I) PCNA, NeuroD1 immunohistochemistry in Cyclopamine, SAG treated and control animals. (J-L) β-III Tubulin, NeuroD1 immunohistochemistry in the P6 cerebellum from Cyclopamine and SAG treated and control animals. (M-O) PCNA, β-III Tubulin immunohistochemistry in Cyclopamine and SAG treated and control animals. The yellow dotted line in Figure 2D-O represents the boundaries of the external granule layer (EGL). Scale bar=20 µm in D-O. (P) Graph showing an increase in the percentage of NeuroD1+ cells in Cyclopamine treated animals as compared to control (*p<0.05). The percentage of NeuroD1+ cells is significantly lower in the SAG treated animal as compared to P6 control (***p<0.001) (n=3, where n=number of animals). Data represented as mean±s.e.m percentage of NeuroD1 positive cells. (Q) Graph showing a decrease in the percentage of PCNA positive cells in Cyclopamine treated animals as compared to control (***p<0.001). The percentage of PCNA+ cells is significantly higher in the SAG treated animal as compared to P6 control (p<0.001) (n=3). Data represented as mean±s.e.m percentage of PCNA positive cells. (R) Graph showing the percentage of parallel (horizontal) cell divisions in Cyclopamine and SAG treated animals and P6 controls (n>3) The number of parallel cell divisions is significantly higher in the EGL of Cyclopamine treated mice (***p<0.001). SAG treatment on the other hand significantly reduces the number of horizontal divisions in the cerebellar EGL (***p<0.001). Data represented as mean±s.e.m. percentage of parallel cell divisions. All p values are based on student t-test.
Fig. 3.
Fig. 3.
Distribution of β-Catenin in anaphase cells of the cerebellar EGL. (A) β-Catenin (red) is localized to the cell (yellow arrow) proximal to the pial surface (dashed line) during an asymmetric parallel division (continuous line). Cells in anaphase were identified by PH3 staining (green). (B) β-Catenin is distributed symmetrically (yellow arrows) when the plane of division (continuous line) is perpendicular to the pial surface (dashed line). (C1-5,D1-5) z-stacks through a cell dividing parallel to the pial surface. The white line around the PH3 (green) shows the ROI for which the fluorescence intensity was calculated. The value to the left shows the total intensity value for PH3 for that z-plane. The yellow line around β-Catenin (red) shows the ROI for which fluorescence intensity values for β-Catenin was calculated and this value is shown on the right for that z-plane. A negative number on the right indicates that the distal cell has a greater fluorescence intensity value and a positive number shows that the proximal cell has a greater fluorescence intensity value. Scale bar=5 µm for all the images.
Fig. 4.
Fig. 4.
Fluorescence intensity ratios of β-Catenin in anaphase cells of the cerebellar EGL. (A) The graph shows the median fluorescence ratio obtained for PH3 (circle) and β-Catenin (triangle) for all the cell pairs at each age. P values between relative fluorescence ratio for PH3 versus β-Catenin was determined by Wilcoxon matched pair one tailed test for every cell at each age (***p<0.001, **p <0.01,*p<0.05). (B) Age grouped median fluorescence ratio with error bars representing interquartile range. The relative fluorescence ratio for β-Catenin increases significantly between P0–P4 and P5–P9 and between P0–P4 and P10–P13 (*p<0.05, **p<0.01, Mann-Whitney U test).
Fig. 5.
Fig. 5.
β-Catenin asymmetry during cerebellar development. Percentage of cells having different amounts of asymmetry: 0–0.15 (symmetric distribution), 0.15–0.30 (weak asymmetry), 0.30–0.45 (asymmetric) and >0.45 (strongly asymmetric) plotted for (A) P0–P4, (B) P5–P9 and (C) P10–P13 respectively. (D) Percentage of asymmetric cells that show more β-Catenin in the cell proximal to the pial surface at P0–P4, P5–P9 and P10–P13. The dashed line in the graph is drawn at 50% which would be the percentage of obtaining proximal asymmetry if there was no bias.
Fig. 6.
Fig. 6.
β-Catenin is asymmetrically distributed in cells exposed to localized signalling molecules such as Shh and Wnt3a. (A) Pattern of Shh when printed on a coverslip using PDMS stamps. (B) In a condition where one of the nuclei (blue) is in contact with the Shh stripe (green) and the other is not, β-Catenin (red) is always asymmetrically distributed to the cell that is in contact with the stripe. (C) However, when both daughter nuclei are in contact with the Shh stripe, β-Catenin is symmetrically distributed to both daughter cells. (D) When one of the daughter nuclei (blue) is in contact with the Wnt3a stripe (red) and the other is not, β-Catenin (green) is always asymmetrically distributed to the nucleus that is in contact with the stripe. (E) However, when both daughter nuclei are in contact with Wnt3a, β-Catenin is symmetrically distributed to both daughter cells. (F) N-Cadherin is asymmetrically distributed to the daughter nucleus in contact with Shh. Scale bar for A=5 µm; B-F=10 µm.

Similar articles

Cited by

References

    1. Alder J., Cho N. K. and Hatten M. E. (1996). Embryonic precursor cells from the rhombic lip are specified to a cerebellar granule neuron identity. Neuron 17, 389-399. 10.1016/S0896-6273(00)80172-5 - DOI - PubMed
    1. Altman J. (1972). Postnatal development of the cerebellar cortex in the rat. I. The external germinal layer and the transitional molecular layer. J. Comp. Neurol. 145, 353-397. 10.1002/cne.901450305 - DOI - PubMed
    1. Anne S. L., Govek E. E., Ayrault O., Kim J. H., Zhu X., Murphy D. A., Van Aelst L., Roussel M. F. and Hatten M. E. (2013). WNT3 inhibits cerebellar granule neuron progenitor proliferation and medulloblastoma formation via MAPK activation. PLoS ONE 8, e81769 10.1371/journal.pone.0081769 - DOI - PMC - PubMed
    1. Attardo A., Calegari F., Haubensak W., Wilsch-Bräuninger M. and Huttner W. B. (2008). Live imaging at the onset of cortical neurogenesis reveals differential appearance of the neuronal phenotype in apical versus basal progenitor progeny. PLoS ONE 3, e2388 10.1371/journal.pone.0002388 - DOI - PMC - PubMed
    1. Bultje R. S., Castaneda-Castellanos D. R., Jan L. Y., Jan Y. N., Kriegstein A. R. and Shi S. H. (2009). Mammalian Par3 regulates progenitor cell asymmetric division via notch signaling in the developing neocortex. Neuron 63, 189-202. 10.1016/j.neuron.2009.07.004 - DOI - PMC - PubMed