. 2015 Apr;7(4):256-68.
doi: 10.18632/aging.100738.

High-fat diet induced obesity primes inflammation in adipose tissue prior to liver in C57BL/6j mice

Affiliations

High-fat diet induced obesity primes inflammation in adipose tissue prior to liver in C57BL/6j mice

Roel A van der Heijden et al. Aging (Albany NY). 2015 Apr.

Abstract

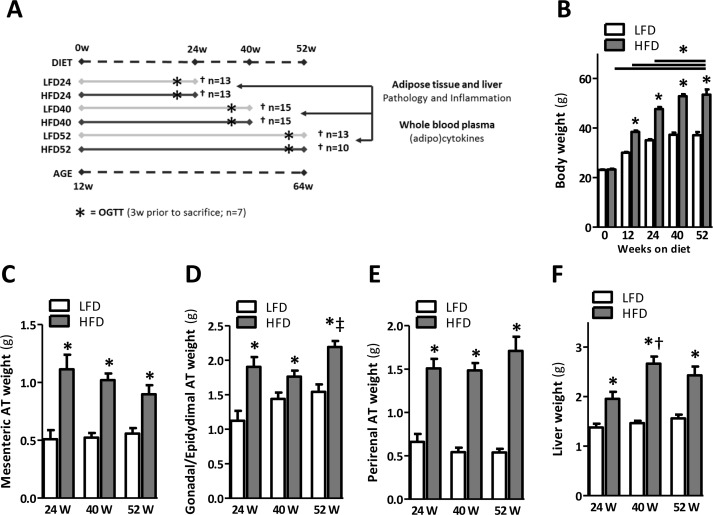
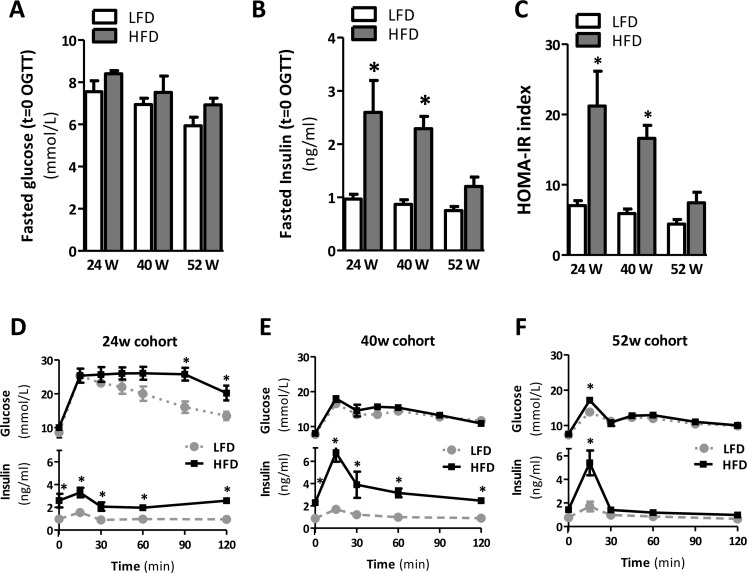
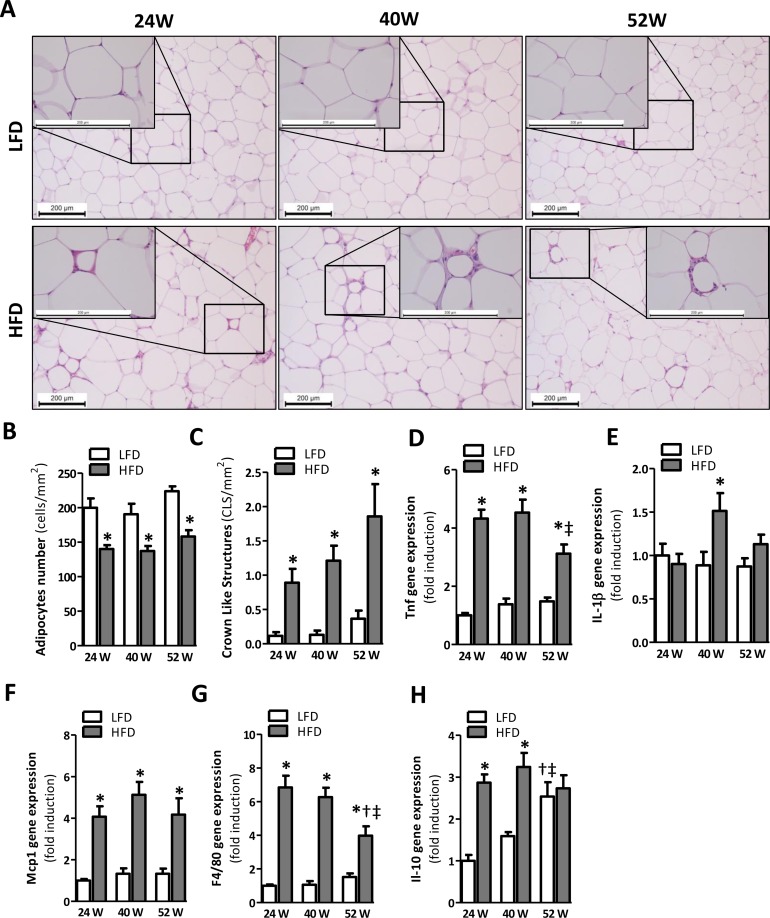
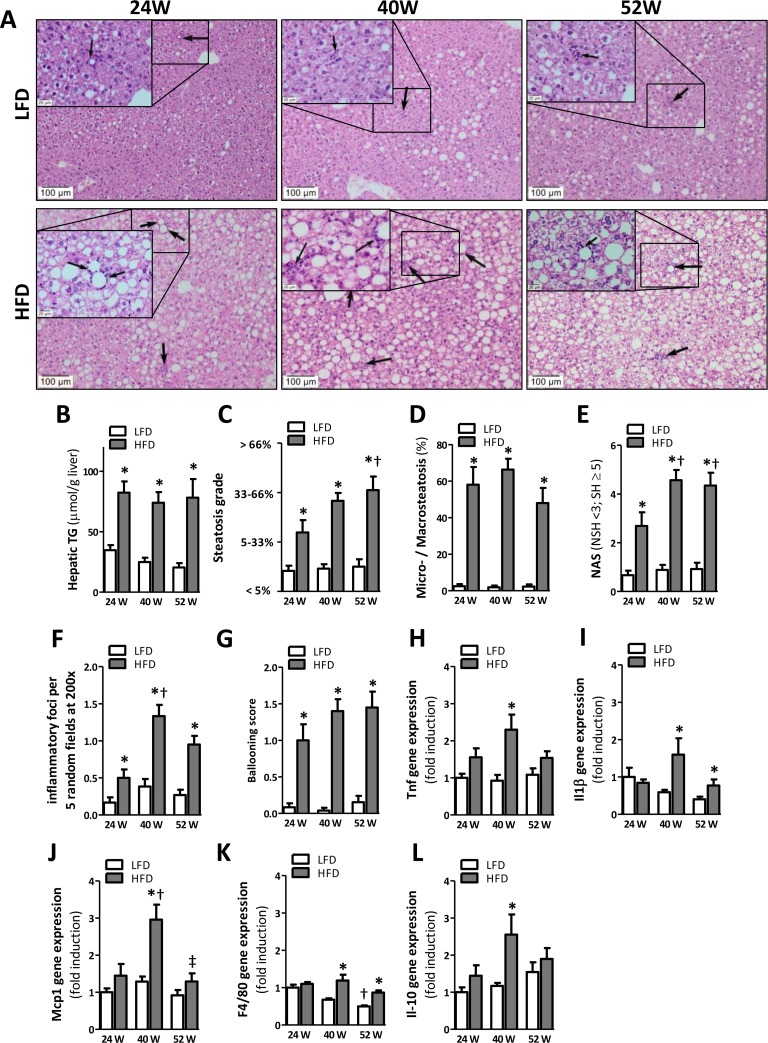
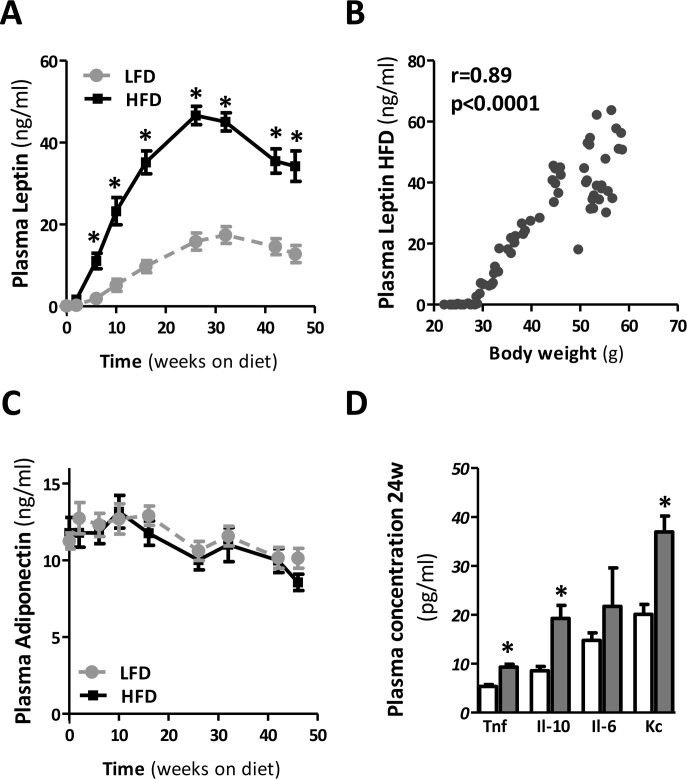
Metabolic inflammation in adipose tissue and the liver is frequently observed as a result of diet-induced obesity in human and rodent studies. Although the adipose tissue and the liver are both prone to become chronically inflamed with prolonged obesity, their individual contribution to the development of metabolic inflammation remains speculative. Thus, we aimed to elucidate the sequence of inflammatory events in adipose and hepatic tissues to determine their contribution to the development of metabolic inflammation and insulin resistance (IR) in diet-induced obesity. To confirm our hypothesis that adipose tissue (AT) inflammation is initiated prior to hepatic inflammation, C57BL/6J male mice were fed a low-fat diet (LFD; 10% kcal fat) or high-fat diet (HFD; 45% kcal fat) for either 24, 40 or 52 weeks. Lipid accumulation and inflammation was measured in AT and liver. Glucose tolerance was assessed and plasma levels of glucose, insulin, leptin and adiponectin were measured at various time points throughout the study. With HFD, C57BL/6j mice developed a progressive obese phenotype, accompanied by IR at 24 and 40 weeks of HFD, but IR was attenuated after 52 weeks of HFD. AT inflammation was present after 24 weeks of HFD, as indicated by the increased presence of crown-like structures and up-regulation of pro-inflammatory genes Tnf, Il1β, Mcp1 and F4/80. As hepatic inflammation was not detected until 40 weeks of HFD, we show that AT inflammation is established prior to the development of hepatic inflammation. Thus, AT inflammation is likely to have a greater contribution to the development of IR compared to hepatic inflammation.

Keywords: NASH; adipose tissue; inflammation; insulin resistance; liver; metabolic syndrome; obesity.


Conflict of interest statement

Conflict of interest statement

The authors declare that they have no competing financial interests or other conflicts of interest.

Figures

Figure 1
Figure 1. Prolonged HFD-feeding leads to obesity and organ adiposity
(A) Experimental design. (B) Body weights of mice fed a LFD and HFD shown at the start and at 12, 24, 40 and 52 weeks after a HFD. (C) Mesenteric, (D) gonadal/epidydimal and (E) perirenal fat depots weights. (F) Liver weight measured upon sacrifice at 24, 40 and 52 weeks. Values shown are means ± SEM (n = 10-15 mice/group). Significance level set at p<0.05. *=significant from LFD at same time point, †=significant from same diet 24w, ‡=significant from same diet 40w.
Figure 2
Figure 2. Prolonged HFD is associated with IR after 24 and 40 weeks but not after 52 weeks of HFD
(A) Fasted plasma glucose and (B) insulin concentrations measured in blood collected prior to oral glucose tolerance test (OGTT). (C) Homeostatic model assessment of IR (HOMA-IR) used as a surrogate marker of IR. (D-F) Blood glucose (top) and plasma insulin (bottom) levels during OGTT after 24, 40 and 52 weeks of LFD and HFD-feeding. Values shown are means ± SEM (n=7 mice/group). Significance level set at p<0.05. *=significant from LFD at same time point, †=significant from same diet 24w, ‡=significant from same diet 40w.
Figure 3
Figure 3. Prolonged HFD-feeding leads to AT inflammation in mice after 24 weeks
(A) Representative pictures from H&E-stained AT sections of LFD and HFD mice after 24 (left), 40 (middle) and 52 (right) weeks of diet with crown-like structures (insets). Histologically quantified number of (B) adipocytes and (C) crown-like structures per mm2 (n=10-15). (D-H) mRNA expression levels of tumor necrosis factor (Tnf), interleukin-1β (Il1β), monocyte chemotactic protein-1 (Mcp1), macrophage marker (F4/80) and interleukin-10 (Il-10) in the AT. All mRNA expression data were normalized to the LFD24 group and expressed as mean ± SEM (n=7-8). Significance level set at p<0.05. *=significant from LFD at same time point, †=significant from same diet 24w, ‡=significant from same diet 40w.
Figure 4
Figure 4. HFD-feeding leads to hepatic steatosis after 24 weeks but inflammation becomes apparent after 40 weeks
(A) Representative pictures from H&E-stained liver sections of LFD and HFD mice after 24 (left), 40 (middle) and 52 (right) weeks of diet with inflammatory foci (arrows; insets). (B) Quantification of hepatic triglycerides. (C) Determination of steatosis grade (0=0-5%; 1=5-33%; 2=33-66%; 3=66-100% coverage), and (D) percentage of microvesicular over macrovesicular steatosis. (E) Determination of NAFLD Activity Score (NAS; sum of steatosis + lobular inflammation + ballooning), score >5 represents steatohepatitis (SH) and pathological scores <3 non-steatohepatitis (NSH). (F) Quantification of inflammatory foci per 5 random fields under 200x magnification and (G) determination of ballooning score. (H-L) mRNA expression levels of tumor necrosis factor (Tnf), monocyte chemotactic protein-1 (Mcp1), macrophage marker (F4/80), interleukin-1β (Il1β), and interleukin-10 (Il-10) in the AT. All mRNA expression data were normalized to the LFD24 group and expressed as mean ±SEM (n=7-8). Significance level set at p<0.05. *=significant from LFD at same time point, †=significant from same diet 24w, ‡=significant from same diet 40w.
Figure 5
Figure 5. Plasma adipokine and cytokine levels during prolonged HFD in mice
(A) Serial plasma leptin and (B) its correlation with body weight, and (C) serial plasma adiponectin throughout the dietary intervention. (D) Plasma cytokine levels in mice fed a LFD and HFD for 24 weeks. (n=10-15 mice/group). Significance level set at p<0.05. *=significant from LFD at same time point.

References

    1. Hotamisligil GS. Inflammation and metabolic disorders. Nature. 2006;444:860–867. - PubMed
    1. Hummasti S, Hotamisligil GS. Endoplasmic reticulum stress and inflammation in obesity and diabetes. Circ. Res. 2010;107:579–591. - PubMed
    1. Cinti S, Mitchell G, Barbatelli G, Murano I, Ceresi E, Faloia E, Wang S, Fortier M, Greenberg AS, Obin MS. Adipocyte death defines macrophage localization and function in adipose tissue of obese mice and humans. J. Lipid Res. 2005;46:2347–2355. - PubMed
    1. Olefsky JM, Glass CK. Macrophages, inflammation, and insulin resistance. Annu. Rev. Physiol. 2010;72:219–246. - PubMed
    1. Shoelson SE, Lee J, Goldfine AB. Inflammation and insulin resistance. J. Clin. Invest. 2006;116:1793–1801. - PMC - PubMed

Publication types