. 2015 Jul;4(7):731-42.
doi: 10.5966/sctm.2014-0270. Epub 2015 May 15.

Robust Expansion of Human Pluripotent Stem Cells: Integration of Bioprocess Design With Transcriptomic and Metabolomic Characterization

Affiliations

Robust Expansion of Human Pluripotent Stem Cells: Integration of Bioprocess Design With Transcriptomic and Metabolomic Characterization

Marta M Silva et al. Stem Cells Transl Med. 2015 Jul.

Abstract

: Human embryonic stem cells (hESCs) have an enormous potential as a source for cell replacement therapies, tissue engineering, and in vitro toxicology applications. The lack of standardized and robust bioprocesses for hESC expansion has hindered the application of hESCs and their derivatives in clinical settings. We developed a robust and well-characterized bioprocess for hESC expansion under fully defined conditions and explored the potential of transcriptomic and metabolomic tools for a more comprehensive assessment of culture system impact on cell proliferation, metabolism, and phenotype. Two different hESC lines (feeder-dependent and feeder-free lines) were efficiently expanded on xeno-free microcarriers in stirred culture systems. Both hESC lines maintained the expression of stemness markers such as Oct-4, Nanog, SSEA-4, and TRA1-60 and the ability to spontaneously differentiate into the three germ layers. Whole-genome transcriptome profiling revealed a phenotypic convergence between both hESC lines along the expansion process in stirred-tank bioreactor cultures, providing strong evidence of the robustness of the cultivation process to homogenize cellular phenotype. Under low-oxygen tension, results showed metabolic rearrangement with upregulation of the glycolytic machinery favoring an anaerobic glycolysis Warburg-effect-like phenotype, with no evidence of hypoxic stress response, in contrast to two-dimensional culture. Overall, we report a standardized expansion bioprocess that can guarantee maximal product quality. Furthermore, the "omics" tools used provided relevant findings on the physiological and metabolic changes during hESC expansion in environmentally controlled stirred-tank bioreactors, which can contribute to improved scale-up production systems.

Significance: The clinical application of human pluripotent stem cells (hPSCs) has been hindered by the lack of robust protocols able to sustain production of high cell numbers, as required for regenerative medicine. In this study, a strategy was developed for the expansion of human embryonic stem cells in well-defined culture conditions using microcarrier technology and stirred-tank bioreactors. The use of transcriptomic and metabolic tools allowed detailed characterization of the cell-based product and showed a phenotypic convergence between both hESC lines along the expansion process. This study provided valuable insights into the metabolic hallmarks of hPSC expansion and new information to guide bioprocess design and media optimization for the production of cells with higher quantity and improved quality, which are requisite for translation to the clinic.

Keywords: Human pluripotent stem cells; Metabolic profiling; Stirred-tank bioreactors; Transcriptional profiling; Xeno-free microcarriers.


Figures

Figure 1.
Figure 1.
Implementation and characterization of a standardized protocol for hESC expansion. Schematic representation of the hESC expansion bioprocess herein developed. Two hESC lines, a feeder-dependent line (hESC-C, in green) and a feeder-free line (hESC-M, in red), were expanded under fully defined conditions using stirred-tank bioreactors and characterized by transcriptomic and metabolic tools toward implementation of a standardized and robust protocol for hESC expansion. The images were acquired using magnification ×100. Abbreviation: hESC, human embryonic stem cell.
Figure 2.
Figure 2.
Human embryonic stem cell attachment and growth on different extracellular matrices. (A): Representative images from phase-contrast microscopy at days 1 and 4 of hESC-C cells expanded on different extracellular matrices. Scale bars = 100 μm. Fold increase in cell concentration (B) and metabolic activity (C) measured by alamarBlue assay for hESC-C cells. Error bars denote the mean ± SD of four measurements. ∗∗, p < .01; ∗∗∗, p < .001 determined by one-way analysis of variance. Abbreviations: CS, CELLstart; MEF-CM, mouse embryonic fibroblast-conditioned medium; MG, Matrigel; Synth, Synthemax; SA, StemAdhere.
Figure 3.
Figure 3.
Expansion and characterization of hESCs on synthetic microcarriers in stirred culture conditions. (A): Representative images from cell-viability assays (fluorescein diacetate, live cells in green; propidium iodide, dead cells in red) of hESC-C and hESC-M cells on microcarriers at the last day of culture. Scale bars = 100 μm. (B): Growth curves of hESC-C and hESC-M cells in spinner vessels on SP microcarriers. (C): Percentage of cell recovery after the harvesting process, using TrypLE Select. (D): Immunofluorescence images of Oct-4 and TRA-1-60 labeling of hESC-M cells on SH microcarriers, and phase contrast images of alkaline phosphatase activity staining of hESC-M cells on SP microcarriers. Scale bars = 100 μm. (E): Flow cytometry analysis: percentages of TRA-1-60-, SSEA-4-, hES-Cellect-, and SSEA-1-positive cells at day 0 and at the last day of culture on SP microcarriers. Error bar denotes SD of 2 measurements. (F): Gene expression of stemness markers Oct-4 and Nanog relative to day 0 of both hESC-C and hESC-M cells cultured on SP microcarriers and 2D culture. Gene expression was quantified using the ΔΔCt method (housekeeping:RPL22; as described elsewhere [29]). The primers' sequences are listed in supplemental online Table 2. Error bar denotes SD of 3 replicates. (G): Images of embryoid bodies of both hESCs (after expansion on SP microcarriers) and the differentiated cultures labeled for α-SMA (mesoderm), FOXA2 (endoderm), and β-III tubulin (ectoderm). Nuclei were stained with DAPI (blue). Scale bars = 100 μm. (H): Hierarchical clustering given by Pearson correlation method implemented in Spotfire of initial and final samples for both hESC lines in the 2D culture system (feeder layer for hESC-C and Coat-1 for hESC-M) and on the Synthemax synthetic surface. ∗∗∗, p < .001 determined by two-way analysis of variance. Abbreviations: 2D, two-dimensional culture; α-SMA, α-smooth muscle actin; DAPI, 4′,6-diamidino-2-phenylindole; FOXA2, forkhead box A2; hESC, human embryonic stem cell; SH, Synthemax II hydrogel; SP, Synthemax II polystyrene.
Figure 4.
Figure 4.
Whole-genome transcriptome analysis of hESCs expanded on Synthemax II polystyrene microcarriers. (A): Transcriptional profiling of selected genes with dynamically changing expression over culture time. hESC-M cells in the 2D culture system (left) versus the bioreactor culture system (right) of glycolysis, amino acid metabolism, cytoskeleton rearrangements, and metallothionein genes. Genes were considered dynamically changing for coefficient of variation CV ≥20% over the 192 hours of culture. A complete list of all genes with CV ≥20% can be found in supplemental online file SFA. A list of the genes composing this figure, fold-change values, CV statistics, and gene abbreviation definitions is provided in supplemental online file SFB. (B): Heat map of converging genes in both hESC lines across significantly enriched pathways given by Ingenuity Pathway Analysis. Heat map of probes with transcriptional convergence during the expansion process. Color gradient indicates gene expression fold-change between the referred samples and “hESC-M day 0.” Dashed box highlights the similarity of gene expression patterns between hESC-C and hESC-M cells by the end of expansion process in Synthemax II polystyrene microcarriers. A complete list of the genes composing this figure, expression values, fold-change, and gene abbreviation definitions can be found in supplemental online file SFD. The microarray dataset presented in this figure was submitted to the Gene Expression Omnibus repository with the accession number GSE63192. Abbreviations: 2D, two-dimensional; C, hESC-C cell line; hESC, human embryonic stem cell; M, hESC-M cell line.
Figure 5.
Figure 5.
Metabolic profiling of hESC-M in the 2D culture system versus stirred-tank bioreactors. hESC-M cells in the 2D culture system (left-sided charts) and the bioreactor culture system (right). (A): Specific rates of glucose consumption and lactate production. Specific amino acid uptake/production rates of group 1, consumed amino acids (B); group 2, produced amino acids (C); and group 3, amino acids with inverted uptake/production profiles (D). For specific rates, negative values denote uptake and positive values denote production. Error bars represent the propagation of error. The curves represent the best fit to points using the fourth order polynomial. Abbreviation: 2D, two-dimensional.
Figure 6.
Figure 6.
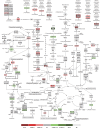
Central carbon metabolism of hESC-M cells expanded in 2D culture system versus stirred-tank bioreactors. Schematic representation of the main reactions of central carbon metabolism, highlighting transcriptome changes of hESC-M cells in the 2D culture system and the bioreactor culture system. Transcriptome changes correspond to fold-change in both culture conditions at the last day of culture, colored according the graphic legend. Each arrow represents a single reaction; reversibility is indicated by a two-arrow line according to the BioCyc database [30]. Dashed arrows are a general representation of metabolites being channeled from or into the indicated pathways. Reactions are shown as a schematic representation and do not necessarily represent a unique possibility for the presented metabolites. For simplicity, only the main metabolites and cofactors are shown, thus the reactions are not necessarily balanced. Not all reactions (arrows) are assigned to an enzyme, either for clarity or because no specific enzyme has been described in the BioCyc database. Genes are shown in corner-rounded boxes, colored according to fold-change, and metabolites are shown unboxed. Enzymatic complexes and multigene-composed proteins are identified by a corner-rounded dashed line surrounding the gene set. Gene sets not surrounded by this line represent different enzymes and/or enzyme isoforms catalyzing the same reaction. Genes were considered to be expressed for average expression level above 1.5-fold the average expression of the background probes. Metabolic map adapted from [31]. The microarray dataset presented in this figure was submitted to the Gene Expression Omnibus repository with the accession number GSE63192. Abbreviations: 2D, two-dimensional; CoA, coenzyme A; DHF, dihydrofolate; FC, fold change; NC, no change; NE, not expressed; Pi, inorganic phosphate; PLP, pyridoxal-5-phosphate; SAH, S-adenosylhomocysteine; SAM, S-adenosylmethionine; THF, tetrahydrofolate.

Similar articles

Cited by

References

    1. Robinton DA, Daley GQ. The promise of induced pluripotent stem cells in research and therapy. Nature. 2012;481:295–305. - PMC - PubMed
    1. Inoue H, Yamanaka S. The use of induced pluripotent stem cells in drug development. Clin Pharmacol Ther. 2011;89:655–661. - PubMed
    1. Chen KG, Mallon BS, McKay RDG, et al. Human pluripotent stem cell culture: Considerations for maintenance, expansion, and therapeutics. Cell Stem Cell. 2014;14:13–26. - PMC - PubMed
    1. Sun Y, Yong KMA, Villa-Diaz LG, et al. Hippo/YAP-mediated rigidity-dependent motor neuron differentiation of human pluripotent stem cells. Nat Mater. 2014;13:599–604. - PMC - PubMed
    1. Serra M, Brito C, Correia C, et al. Process engineering of human pluripotent stem cells for clinical application. Trends Biotechnol. 2012;30:350–359. - PubMed