. 2015 Jun 30;6(18):16507-16.
doi: 10.18632/oncotarget.3757.

Nuclear EGFR impairs ASPP2-p53 complex-induced apoptosis by inducing SOS1 expression in hepatocellular carcinoma

Affiliations

Nuclear EGFR impairs ASPP2-p53 complex-induced apoptosis by inducing SOS1 expression in hepatocellular carcinoma

Kai Liu et al. Oncotarget. .

Abstract

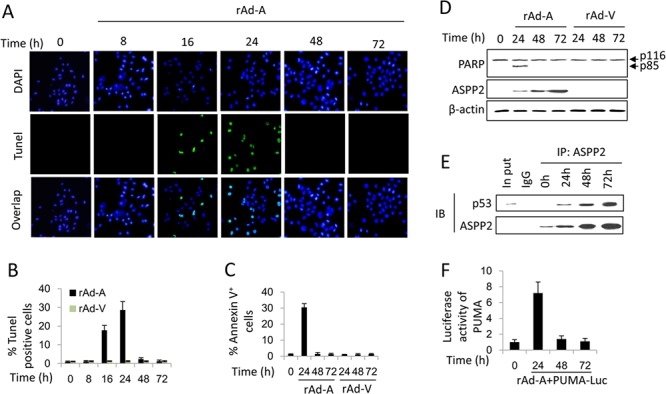
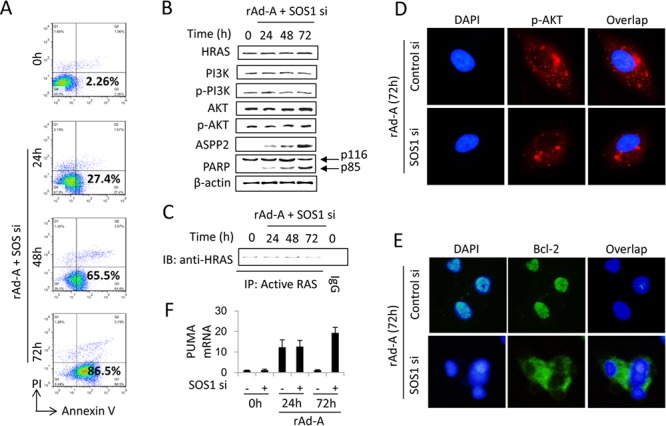
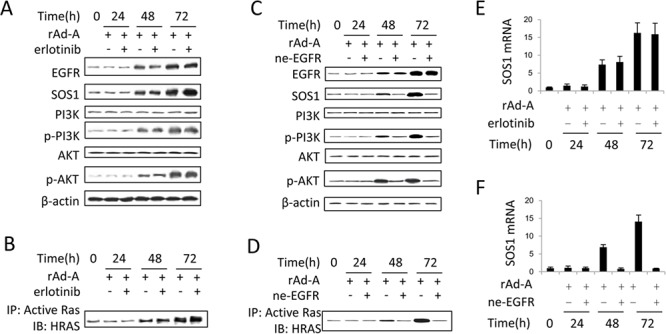
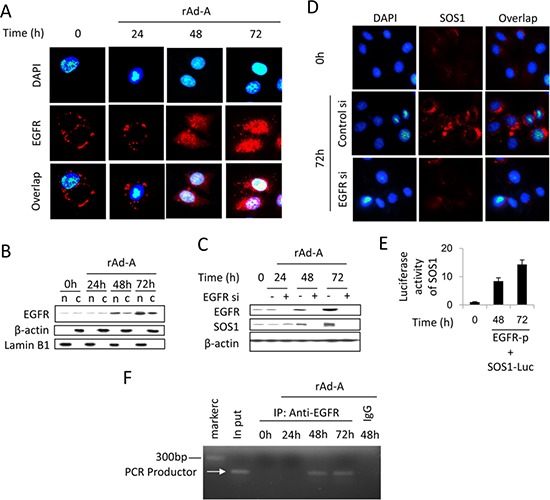
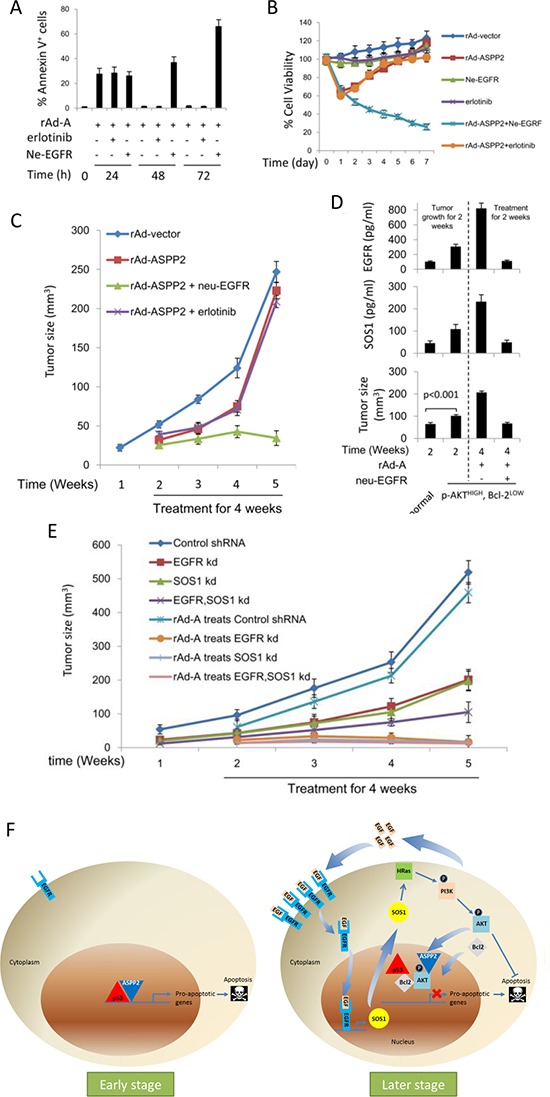
ASPP2 can bind to p53 and enhance the apoptotic capabilities of p53 by guiding it to the promoters of pro-apoptotic genes. Here, ASPP2 overexpression for 24 hours transiently induced apoptosis in hepatoma cells by enhancing the transactivation of p53 on pro-apoptotic gene promoters. However, long-term ASPP2 overexpression (more than 48 hours) failed to induce apoptosis because p53 was released from the pro-apoptotic gene promoters. In non-apoptotic cells, nuclear EGFR induced SOS1 expression by directly binding to the SOS1 promoter. SOS1 activated the HRAS/PI3K/AKT pathway and resulted in nuclear translocation of p-AKT and Bcl-2. The interaction between p-AKT and ASPP2 facilitates Bcl-2 binding to p53, which releases p53 from the pro-apoptotic gene promoters. The in vivo assay demonstrated that EGFR/SOS1-promoted growth of nuclear p-AKT+, Bcl-2+ cells results in the resistance of hepatoma cells to ASPP2-p53 complex-induced apoptosis and that blocking nuclear translocation of EGFR dramatically improves and enhances the pro-apoptotic function of ASPP2. Finally, the activation of the HRAS/PI3K/AKT pathway by EGFR-induced SOS1 also inhibits cisplatin-induced apoptosis, suggesting a common apoptosis-evasion mechanism in hepatoma cells. Because evasion of apoptosis contributes to treatment resistance in hepatoma, our results also support further investigation of combined therapeutic blockade of EGFR and SOS1.

Keywords: ASPP2; EGFR; SOS1; apoptosis; p53.


Conflict of interest statement

CONFLICTS OF INTEREST

All authors declare no conflict of interest.

Figures

Figure 1
Figure 1. ASPP2-induced apoptosis is impaired in hepatoma cells
A. TUNEL assay was used to detect the effect of rAd-ASPP2 (rAd-A) infection-induced ASPP2 overexpression on apoptosis induction in HepG2 cells at 8, 16, 24, 48, and 72 hours. B. Levels of apoptotic cells in (A) are the mean ± SEM of triplicates. C. Annexin V/PI assay was used to detect apoptosis (Annexin V+ cells). Values are the mean ± SEM of triplicates. D. Immunoblot assay was used to detect apoptosis in HepG2 cells infected with rAd-A or rAd-Vector (rAd-V) for the indicated times. Arrow indicates cleaved PARP fragment. E. CO-IP assay was used to detect the formation of ASPP2-p53 complex in HepG2 cells infected with rAd-A for the indicated times. F. Luciferase activity of the PUMA promoter-reporter constructs after transfection into HepG2 cells is shown. Values are the mean ± SEM of triplicates.
Figure 2
Figure 2. Activation of the HRAS/PI3K/AKT pathway inhibits ASPP2-induced apoptosis
(A. upper panel) Immunoblot assay was used to detect the activation of the HRAS/PI3K/AKT pathway in HepG2 cells infected with rAd-ASPP2 (rAd-A) and rAd-Vector (rAd-V) for the indicated times. (A, lower panel) Anti-RAS-GTP antibody (activated RAS) was used to immunoprecipitate total activated RAS, and anti-HRAS was used to detect HRAS levels in total activated RAS. B and D. Annexin V/PI assay was used to detect ASPP2-induced apoptotic cells (Annexin V+ cells) after transfection with siRNA for HRAS, PI3K, AKT, and Bcl-2. Values are the mean ± SEM of triplicates. C. HepG2 cells were infected with rAd-A for 24 and 48 hours. Nuclei (n) and nuclei-free cytoplasm (c) were isolated and immunoblot assay was used to detect Bcl-2 and p-AKT levels in isolated nuclei and cytoplasm fractions. E. rAd-A-infected HepG2 cells were transfected with the indicated siRNAs. After 24 and 48 hours, the nuclei (Nuc) were isolated. Co-immunoprecipitation assay was used to detect the interaction between ASPP2, p53, p-AKT and Bcl-2 in isolated nuclei. F. ChIP assay using an anti-p53 antibody to the p53-binding region in the PUMA promoter in rAd-A-infected HepG2 cells with or without siRNA knockdown of AKT/Bcl-2 (left panel). rAd-A-infected HepG2 cells were transfected or co-transfected with the indicated siRNAs for 24, 48 and 72 hours. Luciferase activity of the PUMA promoter-reporter is shown (right panel). Values are the mean ± SEM of triplicates.
Figure 3
Figure 3. p-AKT facilitates the interaction between Bcl-2 and p53 in the nucleus
A. Recombinant ASPP2 fragment (Re-ASPP2, which contains ankyrin repeats and SH3 domain, upper panel), Recombinant Bcl-2 (Re-Bcl-2, middle panel) or Recombinant AKT (Re-AKT, lower panel) was cultured with GST-p53. Immunoblot assay was used to detect the ASPP2-p53 (upper panel), p53-Bcl-2 (middle panel) or p53-AKT (lower panel) complex. B. Re-ASPP2, Re-Bcl-2, or Re-AKT was co-cultured with GST-p53. Immunoblot was used to detect the ASPP2-p53, p53-Bcl-2 or p53-AKT complex. C. Re-ASPP2 or Re-Bcl-2 was cultured with GST-AKT, and immunoblotting was used to detect the ASPP2-AKT or Bcl-2-AKT complex. D. Re-Bcl-2 and Re-AKT were co-cultured with GST-ASPP2 (which contains ankyrin repeats and SH3 domain), and immunoblotting was used to detect the ASPP2-AKT or ASPP2-Bcl-2 complex. E. rAd-ASPP2 (rAd-A)-infected HepG2 cells were transfected with wild type AKT plasmid or AKT-K179A, T308A, or S473A-mutant plasmid. CO-IP was used to detect the complex of ASPP2-wild type AKT or ASPP2-mutant AKT (right panel). Immunoblotting was used to detect the level of wild type AKT and mutant AKT in isolated nuclei (left panel). F. A model describes how ASPP2, AKT, Bcl-2, and p53 interact with each other in the nuclei.
Figure 4
Figure 4. SOS1 expression is critical for activating the HRAS/PI3K/AKT pathway and maintaining nuclear translocation of p-AKT and Bcl-2
HepG2 cells were transfected with SOS1 siRNA (SOS1 si) for 24 hours and then infected by rAd-ASPP2 (rAd-A) for 72 hours. A. Annexin V/PI assay was used to detect ASPP2-induced apoptotic cells (Annexin V+ cells). B and C. The indicated antibodies were used to detect the HRAS/PI3K/AKT pathway (B); anti-RAS-GTP antibody was used to immunoprecipitate total activated RAS, and then anti-HRAS was used to detect activated HRAS (C). D and E.) Immunofluorescence assay was used to detect nuclear p-AKT (D, red) and Bcl-2 (E, green). DAPI was used to stain nuclei. F. Real-time PCR was used to detect PUMA mRNA. Values are the mean ± SEM of triplicates.
Figure 5
Figure 5. EGFR tyrosine kinase has no effect on activation of the SOS1/HRAS/PI3K/AKT pathway
A and C. Immunoblot assay was used to detect the activation of the EGFR/SOS1/HRAS/PI3K/AKT pathway in rAd-ASPP2 (rAd-A)-infected HepG2 cells treated with erlotinib (A) or anti-EGFR neutralizing antibody (ne-EGFR) (C). B and D. Anti-RAS-GTP antibody was first used to immunoprecipitate total activated RAS, and then anti-HRAS antibody was used to detect activated HRAS in rAd-A-infected HepG2 cells treated with erlotinib (B) or ne-EGFR (D). E and F. Real-time PCR was used to detect the SOS1 levels. Values are the mean ± SEM of triplicates.
Figure 6
Figure 6. Nuclear EGFR positively regulates SOS1 expression
A. Immunofluorescence was used to detect EGFR expression (red) in HepG2 cells after rAd-ASPP2 (rAd-A) infection for 24, 48 and 72 hours. Nuclei were stained with DAPI. B. HepG2 cells were infected with rAd-A for 24, 48 and 72 hours. Nuclei (n) and nuclei-free cytoplasm (c) were isolated, and immunoblot assay was used to detect the level of nuclear and cytoplasmic EGFR. C. HepG2 cells were infected with rAd-ASPP2 (rAd-A) with or without EGFR siRNA (EGFR si) treatment. Immunoblotting was used to detect EGFR and SOS1 expression. D. Immunofluorescence assay was used to detect SOS1 expression (red) in rAd-A-treated HepG2 cells for 72 hours with or without EGFR knockdown. Nuclei were stained with DAPI. E. Luciferase activity of SOS1. HepG2 cell were co-transfected with SOS1 reporter (SOS1-Luc) and EGFR (EGFR-p) plasmids for 48 and 72 hours. Values are the mean ± SEM of triplicates. F. Anti-EGFR antibody and control IgG were used for the chromatin immunoprecipitation (ChIP) assay in rAd-A-infected HepG2 cells, followed by PCR and ethidium bromide stained agarose gel electrophoresis.
Figure 7
Figure 7. Anti-EGFR neutralizing antibody improves and enhances ASPP2-induced apoptosis in vitro and in vivo
A. HepG2 cells were infected with rAd-ASPP2 (rAd-A) with or without co-treatment with erlotinib or anti-EGFR neutralizing antibody (ne-EGFR) for 24, 48 and 72 hours. Annexin V/PI assay was used to detect apoptosis (Annexin V+ cells). Values are the mean ± SEM of triplicates. B. MTT assay was used to detect cell viability after treatment with rAd-vector, rAd-ASPP2, ne-EGFR, erlotinib, rAd-ASPP2 combined with ne-EGFR and rAd-ASPP2 combined with erlotinib for 7 days in HepG2 cells. C. HepG2 cells were implanted subcutaneously in nude mice. After 1 week, mice were treated with rAd-vector, rAd-ASPP2, rAd-ASPP2 combined with ne-EGFR, and rAd-ASPP2 combined with erlotinib every week for a total of 4 times. At the indicated time points, tumor size was analyzed to evaluate the effect of the different treatments on inhibiting transplanted tumor growth in vivo. D. HepG2 cells were infected with rAd-ASPP2 for 72 hours. Flow cytometry was used to isolate p-AKTHIGH,Bcl-2LOW cells. p-AKTHIGH, Bcl-2LOW cells were implanted subcutaneously in nude mice, and normal HepG2 cells were used as a control. After 2 weeks, mice were treated with rAd-A and rAd-A combined with ne-EGFR every week, for a total of 2 times. After 2 weeks of treatment, tumor size was analyzed to evaluate the treatments (lower panel). ELISA was used to detect EGFR (upper panel) and SOS1 (middle panel) levels in the transplanted tumor. Values are the mean ± SEM of triplicates. E. EGFR knockdown (EGFR kd), SOS1 knockdown (SOS1 kd), EGFR and SOS1 dual knockdown (EGFR, SOS1 kd) HepG2 cell lines were implanted subcutaneously in nude mice for 1 week, after which rAd-A treatment was administered every week for a total of 4 times. At the indicated time points, tumor size was analyzed to evaluate the effect of rAd-A on treating transplanted tumor growth. Control shRNA treated-HepG2 cells were used as the control. F. A model to demonstrate how apoptosis is induced at early stages of ASPP2 overexpression and how ASPP2 overexpression fails to induce apoptosis at later stages.

Similar articles

Cited by

References

    1. Hengartner MO. The biochemistry of apoptosis. Nature. 2000;407:770–776. - PubMed
    1. Fulda S. Tumor resistance to apoptosis. Int J Cancer. 2009;124:511–515. - PubMed
    1. El-Serag HB, Rudolph KL. Hepatocellular carcinoma: epidemiology and molecular carcinogenesis. Gastroenterology. 2007;132:2557–2576. - PubMed
    1. Penuelas I, Mazzolini G, Boan JF, Sangro B, Marti-Climent J, Ruiz M, et al. Positron emission tomography imaging of adenoviral-mediated transgene expression in liver cancer patients. Gastroenterology. 2005;128:1787–1795. - PubMed
    1. Bergamaschi D, Samuels Y, O'Neil NJ, Trigiante G, Crook T, Hsieh JK, et al. iASPP oncoprotein is a key inhibitor of p53 conserved from worm to human. Nat Genet. 2003;33:162–167. - PubMed

Publication types

MeSH terms