. 2015 May 18:6:7142.
doi: 10.1038/ncomms8142.

Rise to modern levels of ocean oxygenation coincided with the Cambrian radiation of animals

Affiliations

Rise to modern levels of ocean oxygenation coincided with the Cambrian radiation of animals

Xi Chen et al. Nat Commun. .

Abstract

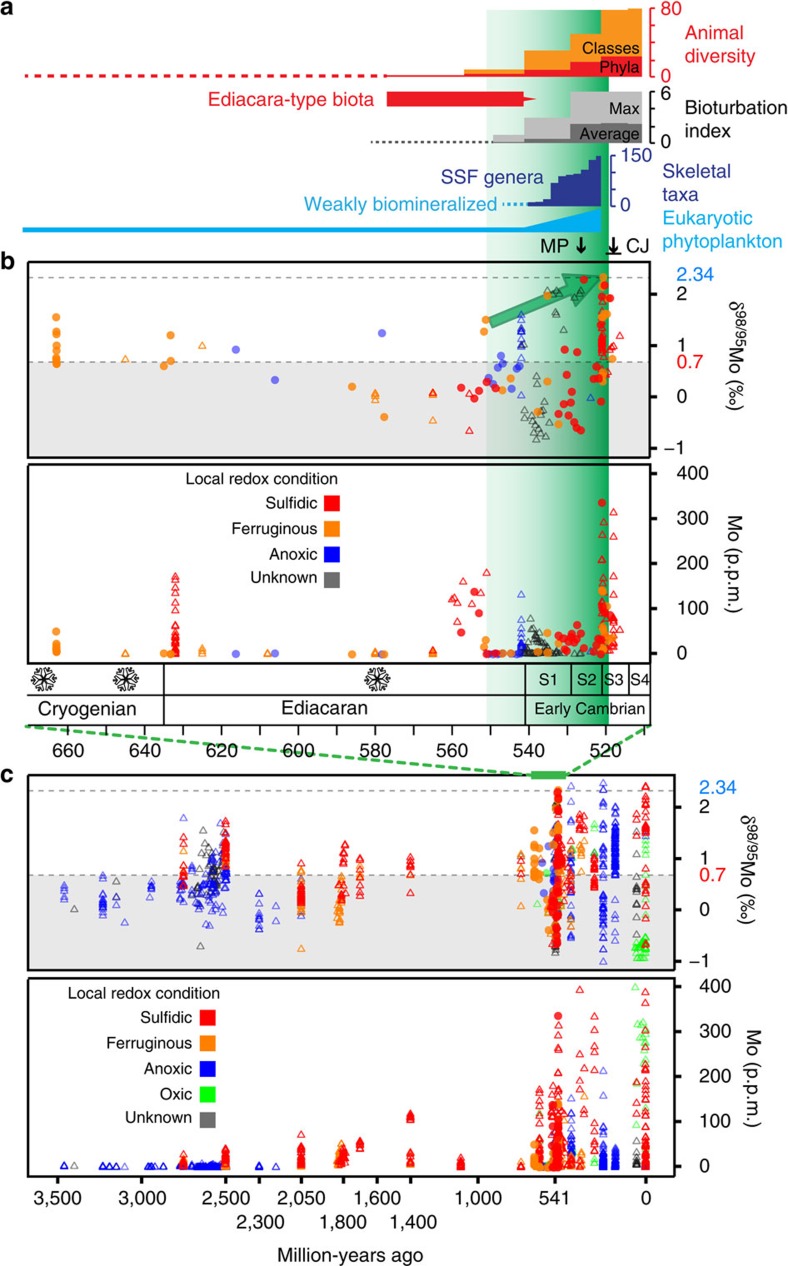
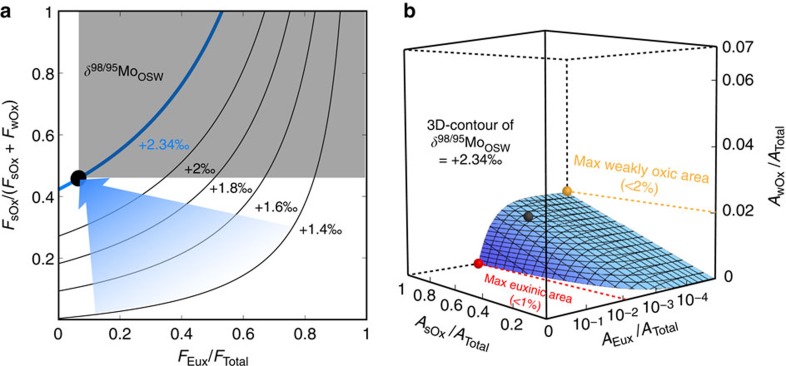
The early diversification of animals (∼ 630 Ma), and their development into both motile and macroscopic forms (∼ 575-565 Ma), has been linked to stepwise increases in the oxygenation of Earth's surface environment. However, establishing such a linkage between oxygen and evolution for the later Cambrian 'explosion' (540-520 Ma) of new, energy-sapping body plans and behaviours has proved more elusive. Here we present new molybdenum isotope data, which demonstrate that the areal extent of oxygenated bottom waters increased in step with the early Cambrian bioradiation of animals and eukaryotic phytoplankton. Modern-like oxygen levels characterized the ocean at ∼ 521 Ma for the first time in Earth history. This marks the first establishment of a key environmental factor in modern-like ecosystems, where animals benefit from, and also contribute to, the 'homeostasis' of marine redox conditions.


Figures

Figure 1
Figure 1. Compilation of Mo data together with biodiversity and degree of bioturbation during the Ediacaran–Cambrian transition.
(a) Bioturbation indices and diversities of animals, skeletal taxa and eukaryotic phytoplankton. MP: mesozooplankton appeared; CJ: the Chengjiang Lagerstätte. (b) Mo data from the mid-Cryogenian to the early Cambrian. In the timescale, three major glaciations are marked as snowflakes, S1 to S4 denote the first four Cambrian stages. The colour of the data points denotes local redox: sulphidic (FePy/FeHR>0.7, red), ferruginous (FePy/FeHR<0.7, orange), anoxic (blue, when Fe speciation data are not available, Fe/Al>0.5, trace metal enrichments and other sedimentary characteristics are used to discriminate anoxic conditions) and unknown (grey, no above mentioned data are available, also included are typical carbonates and phosphates, to which Fe-S-C systematics redox proxies cannot easily be applied). The dashed lines mark the average δ98/95Mo value of modern seawater (+2.34‰) and the riverine input (+0.7‰). Data sources, filled circles: this study; open triangles: published data. Mo concentrations of samples from the early Cambrian Ni–Mo ore layer are not shown because of their exceptional enrichment in Mo (in the percent range). The green arrow marks the rising maximal δ98/95Mo values. The graded green shading in a,b denotes postulated oxygenation of the ocean from the late Ediacaran to the early Cambrian. (c) Mo data from the Palaeoarchaean to present (Supplementary Data 1). Symbols as in b, and green colour stands for oxic condition (FeHR/FeT<0.38 and/or Fe/Al<0.5).
Figure 2
Figure 2. Model of open ocean seawater δ98/95Mo (δ98/95MoOSW) in response to different proportions of Mo sinks.
(a) Contours of δ98/95MoOSW as a function of the relative sizes of the euxinic (FEux), weakly oxic (FwOx) and strongly oxic (FsOx) sinks, assuming that the Mo cycle is in steady state. The black dot represents the modern budget. The upper shaded area would represent coupled expansion of euxinia and the strongly oxic condition relative to the weakly oxic condition, which is unrealistic. The blue arrow denotes a possible oxygenation trend of the ocean, dictated by the Mo data and the model, from the Neoproterozoic to the early Cambrian. (b) A 3D contour surface of δ98/95MoOSW=+2.34‰ as a function of areal (A) fractions of the above redox settings, assuming that the Mo cycle is in steady state. The black dot represents modern redox area distributions; red and yellow dots represent maximum euxinic (1%) and weakly oxic (2%) areas, respectively.

References

    1. Erwin D. H. et al. The Cambrian conundrum: early divergence and later ecological success in the early history of animals. Science 334, 1091–1097 (2011). - PubMed
    1. Xiao S. & Laflamme M. On the eve of animal radiation: phylogeny, ecology and evolution of the Ediacara biota. Trends Ecol. Evol. 24, 31–40 (2009). - PubMed
    1. Knoll A. H. & Carroll S. B. Early animal evolution: emerging views from comparative biology and geology. Science 284, 2129–2137 (1999). - PubMed
    1. Mills D. B. & Canfield D. E. Oxygen and animal evolution: did a rise of atmospheric oxygen ‘trigger' the origin of animals? Bioessays 36, 1145–1155 (2014). - PubMed
    1. Holland H. D. The oxygenation of the atmosphere and oceans. Philos. Trans. R Soc. B 361, 903–915 (2006). - PMC - PubMed

Publication types