. 2015 May 26;11(8):1220-35.
doi: 10.1016/j.celrep.2015.04.037. Epub 2015 May 14.

Differential Role of Insulin/IGF-1 Receptor Signaling in Muscle Growth and Glucose Homeostasis

Affiliations

Differential Role of Insulin/IGF-1 Receptor Signaling in Muscle Growth and Glucose Homeostasis

Brian T O'Neill et al. Cell Rep. .

Abstract

Insulin and insulin-like growth factor 1 (IGF-1) are major regulators of muscle protein and glucose homeostasis. To determine how these pathways interact, we generated mice with muscle-specific knockout of IGF-1 receptor (IGF1R) and insulin receptor (IR). These MIGIRKO mice showed >60% decrease in muscle mass. Despite a complete lack of insulin/IGF-1 signaling in muscle, MIGIRKO mice displayed normal glucose and insulin tolerance. Indeed, MIGIRKO mice showed fasting hypoglycemia and increased basal glucose uptake. This was secondary to decreased TBC1D1 resulting in increased Glut4 and Glut1 membrane localization. Interestingly, overexpression of a dominant-negative IGF1R in muscle induced glucose intolerance in MIGIRKO animals. Thus, loss of insulin/IGF-1 signaling impairs muscle growth, but not whole-body glucose tolerance due to increased membrane localization of glucose transporters. Nonetheless, presence of a dominant-negative receptor, even in the absence of functional IR/IGF1R, induces glucose intolerance, indicating that interactions between these receptors and other proteins in muscle can impair glucose homeostasis.


Figures

Figure 1
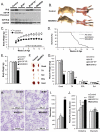
Figure 1. Deletion of IR and IGF1R in muscle dramatically decreases muscle size and survival
Western blot of insulin receptor-β (IR-β) and IGF-1 receptor-β (IGF1R-β) was measured in quadriceps from mice with muscle-specific deletion of insulin receptor (M-IR−/−), IGF-1 receptor (M-IGF1R−/−), or both IGF-1 receptor and insulin receptor (MIGIRKO) (A). Representative profile and hindlimb dissection of control and MIGIRKO littermate mice (B). Body weight was measured weekly in control and MIGIRKO mice (C) (n=7-16). Survival curve of MIGIRKO mice compared to control, M-IR−/−, and M-IGF1R−/−, represented as “All other genotypes” (D) (n=14-20 per group). Body weight was measured at time of sacrifice of control, M-IR−/−, M-IGF1R−/−, and MIGIRKO mice (E) (n=5-8 knockout mice and pooled 20 controls). Representative muscle dissection from control and MIGIRKO mice (F). Dissected muscle weights measured from control, M-IR−/−, M-IGF1R−/−, and MIGIRKO mice (G) (n=5-9 knockout mice and pooled 22 controls). Representative cross section of TA muscle stained for SDH to demonstrate oxidative (purple) and glycolytic (gray/white) muscle fibers from control, M-IR−/−, M-IGF1R−/−, and MIGIRKO mice (H). Quantification of total number of muscle fibers normalized to cross sectional area of TA sections in mm2 (I). Quantification of total oxidative and glycolytic fibers per TA section (J) (n=3-6 per group). (*-p<0.05, **-p<0.01 vs. control, ANOVA) All mice were 11-15 weeks old. Quad – quadriceps, TA – tibialis anterior, EDL – extensor digitorum longus, Sol – soleus, Gast – Gastrocnemius, SDH – Succinate Dehydrogenase. See also Figures S1-S2 and Table S2.
Figure 2
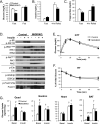
Figure 2. MIGIRKO mice display normal glucose tolerance, fasting hypoglycemia, and increased basal glucose uptake into muscle, despite abolished insulin signaling in muscle
Blood glucose levels were measured in 8-10 week old MIGIRKO and control mice fasted overnight or randomly fed (A) (n=9-10). Insulin (B) and triglyceride (C) levels from 8-10 week-old MIGIRKO and control mice fasted overnight or refed for 4 hours (n=9-10). Insulin signaling was determined by western blot analysis in quadriceps muscle from 11-15 week-old MIGIRKO and control mice fasted overnight and treated with saline or insulin intravenously (D). Intraperitoneal glucose tolerance test (GTT) (E) and insulin tolerance test (ITT) (F) were performed in 8-10 week-old MIGIRKO and control mice (n=9-10). In vivo 2-deoxyglucose uptake was performed as described in Methods in control and MIGIRKO mice (G) (n=6-8 per group). (**-p<0.01 vs. control, student's t-test; #-p<0.05 vs. control with same treatment, †-p<0.05 vs. basal of same genotype, ANOVA) Quad – quadriceps, Gastroc – gastrocnemius, BAT – brown adipose tissue. See also Figure S3.
Figure 3
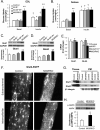
Figure 3. Deletion of muscle IR and IGF1R paradoxically increases glucose transporter expression and membrane localization
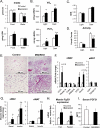
Ex vivo 2-deoxyglucose uptake was measured in EDL (A) and soleus (B) from 8-10 week-old control, M-IR−/−, M-IGF1R−/−, and MIGIRKO mice (n=5 knockouts and 12 pooled controls). Glut1 (C) and Glut4 (D) total protein measured by Western blot in control, M-IR−/−, M-IGF1R−/−, and MIGIRKO quadriceps (n=4). Glut1 and Glut4 mRNA levels were measured in quadriceps from control, M-IR−/−, M-IGF1R−/−, and MIGIRKO mice by qPCR (E) (n=5-8). Glut4-EGFP was transfected into vastus lateralus muscle and visualized 5 days later as described in Methods (F) Bar = 10 μm (n=2). Glut1 and Glut4 levels in plasma membrane (PM) isolates from mixed hindlimb muscle (G) (n=3). Phosphorylation of AMPKT172 was measured in quadriceps (H) (n=4). (*-p<0.05, **-p<0.01 vs. control; †-p<0.05 vs. basal of same genotype, ANOVA) See also Figure S4 and Table S1 and S3.
Figure 4
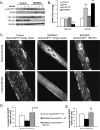
Figure 4. Deletion of IR and IGF1R in muscle leads to suppression of TBC1D1, and re-expression of TBC1D1 normalizes Glut4 localization
AS160 phospho- and total protein, phospho-Akt substrate 160 kDa band (PAS 160), as well as TBC1D1 total protein were measured by Western blot in control and MIGIRKO quadriceps (A) (n=4). TBC1D1 and AS160 mRNA levels were measured in TA muscle from control, M-IR−/−, M-IGF1R−/−, and MIGIRKO mice by qPCR (C) (n=4-8). Glut4-EGFP was transfected into vastus lateralus muscle along with empty vector (EV) or with TBC1D1 and visualized 5 days later in the fed state (C) Bar = 10 μm. Quantification of average area of all Glut4 depots >1 μm from control and MIGIRKO mice transfected with Glut4-EGFP + EV and MIGIRKO transfected with Glut4-EGFP + TBC1D1. (D and E) (n=2 control and 3 MIGIRKO mice per group with 3-7 fibers each). (*-p<0.05, **-p<0.01 vs. control ANOVA; §-p<0.05 vs. MIGIRKO + EV, student's t-test) See also Figure S4 and Table S1.
Figure 5
Figure 5. Increased energy expenditure in MIGIRKO mice is associated with browning of subcutaneous fat
Daily food and water intake were measured in control and MIGIRKO animals and normalized per mouse or per milligram of lean body weight (LBW) (A) (n=9-10). Oxygen consumption (VO2) and carbon dioxide production (VCO2) per kg of LBW were measured using CLAMS metabolic cages (B) (n=9-10). Respiratory exchange ratio (RER) was measured in control and MIGIRKO mice(C) (n=9-10). Activity was measured as the number of times an animal crossed a horizontal laser (D) (n=9-10). Hematoxylin and Eosin staining was performed on inguinal subcutaneous white adipose tissue (sWAT) from control and MIGIRGO animals (E). Markers of brown adipose tissue (BAT) were measured by QPCR in sWAT and epididymal WAT (eWAT) (F). In vivo 2-deoxyglucose uptake under basal or insulin-stimulated conditions was measured in sWAT and eWAT from control and MIGIRKO mice (G). Fgf21 mRNA levels from quadriceps of MIGIRKO and control mice either randomly fed or fasted for 16 hours were measured by qPCR (H). Serum FGF21 levels in randomly fed control and MIGIRKO mice (I). (*-p<0.05, **-p<0.01 vs. control, student's t-test; #-p<0.05 vs. control with same treatment, †-p<0.05 vs. basal of same genotype, ANOVA). See also Table S1 and S4.
Figure 6
Figure 6. MIGIRKO mice are not predisposed to diabetes even after high fat diet feeding
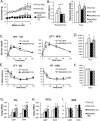
Body weights of control and MIGIRKO mice were measured weekly while on chow diet (CD) or high fat diet (HFD) beginning at 6 weeks of age (A) (n=4-8). Serum insulin levels from randomly fed mice and triglycerides from overnight fasted control and MIGIRKO mice on CD or HFD for 4 weeks (B) (n=4-8). Intraperitoneal glucose tolerance test (GTT) (C) was performed and area under the curve (AUC) (D) was calculated for MIGIRKO and control mice on CD or HFD for 9 weeks (n=3-9). Intraperitoneal insulin tolerance test (ITT) (E) was performed and area above the curve (AAC) (F) was calculated for mice on CD or HFD for 8 weeks (n=3-9). VO2 (G), VCO2 (H), and RER (I) were measured in animals on CD or HFD during both light and dark cycles using CLAMS metabolic cages (n=3-9). (*-p<0.05 vs. control with same diet, †-p<0.05 vs. CD of same genotype, student's t-test). See also Figure S5.
Figure 7
Figure 7. Overexpression of a dominant negative, kinase inactive IGF1R in muscle of MIGIRKO mice induces glucose intolerance and impaired glucose uptake in heart
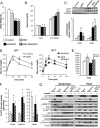
Body weight was measured in 8-10 week-old control mice, mice with overexpression of a kinase inactive IGF1R in muscle (MKR), MIGIRKO mice, and MKR-MIGIRKO mice (A) (n=3-7). Blood glucose was measured in 8-10 week-old control, MKR, MIGIRKO, and MKR-MIGIRKO mice after an overnight fast and after 4 hours of refeeding (B) (n=3-7). Glut1 and Glut4 were measured in quadriceps (C) (n=8-10). Intraperitoneal glucose tolerance test (GTT) (D) was performed and area under the curve (AUC) (E) was calculated for 7-15 week-old mice (n=4-7). In vivo 2-deoxyglucose uptake was performed during an IV GTT in control, MKR, MIGIRKO, and MKR-MIGIRKO mice (F) (n=6-11). Western blots for IGF1R expression and insulin signaling were performed on quadriceps and heart from control, MKR, MIGIRKO, and MKR-MIGIRKO mice after a 5 U of insulin via IVC. (*-p<0.05, **-p<0.01 vs. control ANOVA, #-p<0.05 vs. MIGIRKO, student's t-test). See also Figure S7-S8.

References

    1. An D, Toyoda T, Taylor EB, Yu H, Fujii N, Hirshman MF, Goodyear LJ. TBC1D1 regulates insulin- and contraction-induced glucose transport in mouse skeletal muscle. Diabetes. 2010;59:1358–1365. - PMC - PubMed
    1. Bostrom P, Wu J, Jedrychowski MP, Korde A, Ye L, Lo JC, Rasbach KA, Bostrom EA, Choi JH, Long JZ, Kajimura S, Zingaretti MC, Vind BF, Tu H, Cinti S, Hojlund K, Gygi SP, Spiegelman BM. A PGC1-alpha-dependent myokine that drives brown-fat-like development of white fat and thermogenesis. Nature. 2012;481:463–468. - PMC - PubMed
    1. Boucher J, Macotela Y, Bezy O, Mori MA, Kriauciunas K, Kahn CR. A kinase-independent role for unoccupied insulin and IGF-1 receptors in the control of apoptosis. Sci. Signal. 2010;3:ra87. - PMC - PubMed
    1. Boucher J, Mori MA, Lee KY, Smyth G, Liew CW, Macotela Y, Rourk M, Bluher M, Russell SJ, Kahn CR. Impaired thermogenesis and adipose tissue development in mice with fat-specific disruption of insulin and IGF-1 signalling. Nat. Commun. 2012;3:902. - PMC - PubMed
    1. Bruning JC, Michael MD, Winnay JN, Hayashi T, Horsch D, Accili D, Goodyear LJ, Kahn CR. A muscle-specific insulin receptor knockout exhibits features of the metabolic syndrome of NIDDM without altering glucose tolerance. Mol Cell. 1998;2:559–569. - PubMed

Publication types

LinkOut - more resources