. 2015 May 21;161(5):1101-1111.
doi: 10.1016/j.cell.2015.04.043. Epub 2015 May 14.

Structural Insights into the Dynamic Process of β2-Adrenergic Receptor Signaling

Affiliations

Structural Insights into the Dynamic Process of β2-Adrenergic Receptor Signaling

Aashish Manglik et al. Cell. .

Erratum in

  • Cell. 2015 Sep 10;162(6):1431

Abstract

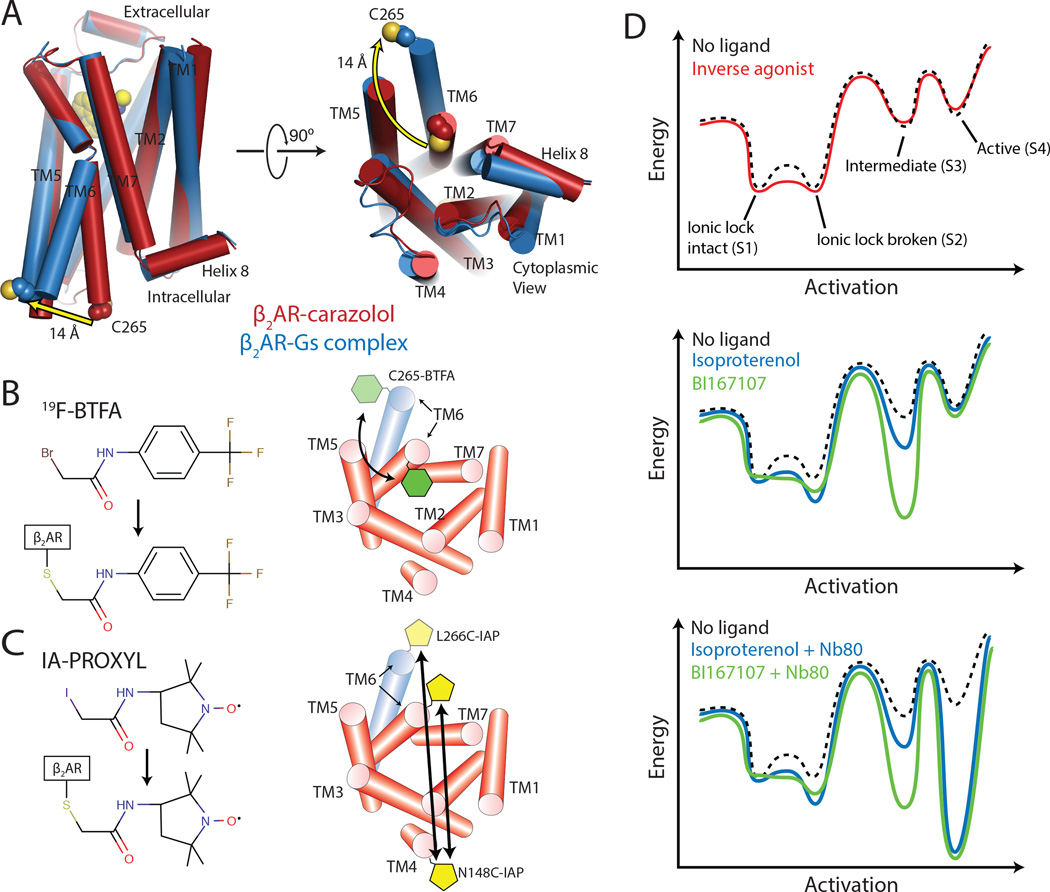
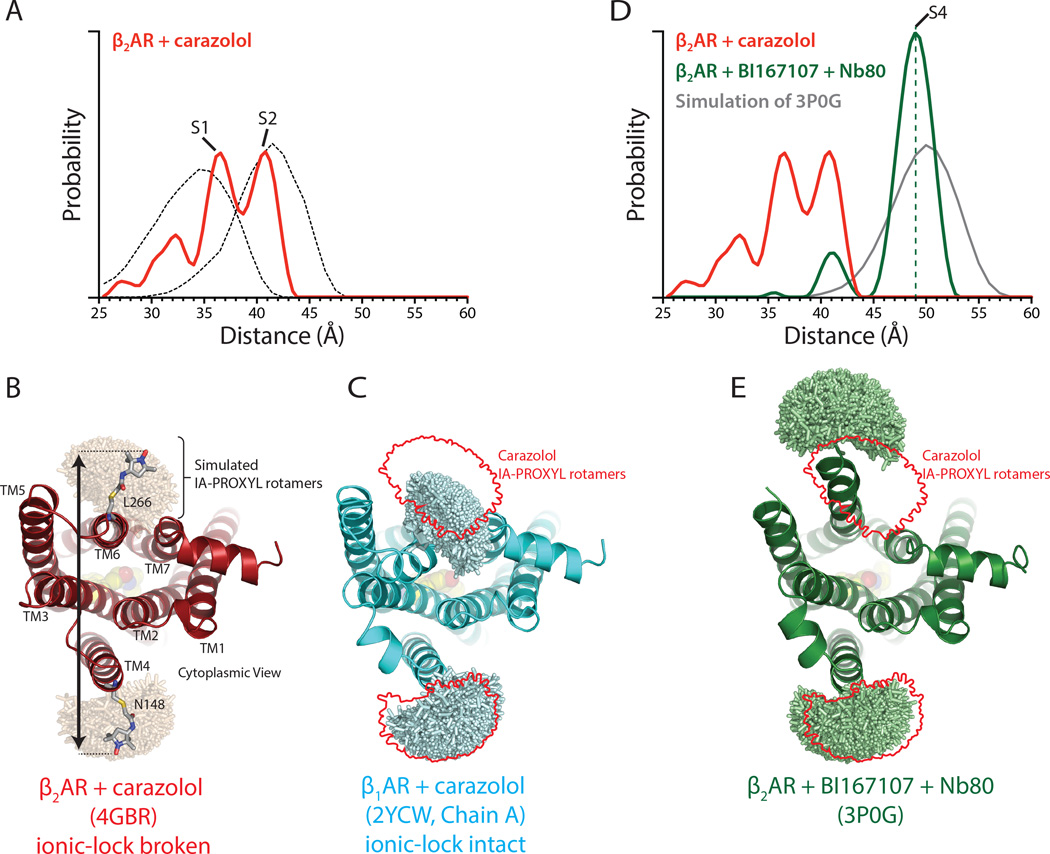
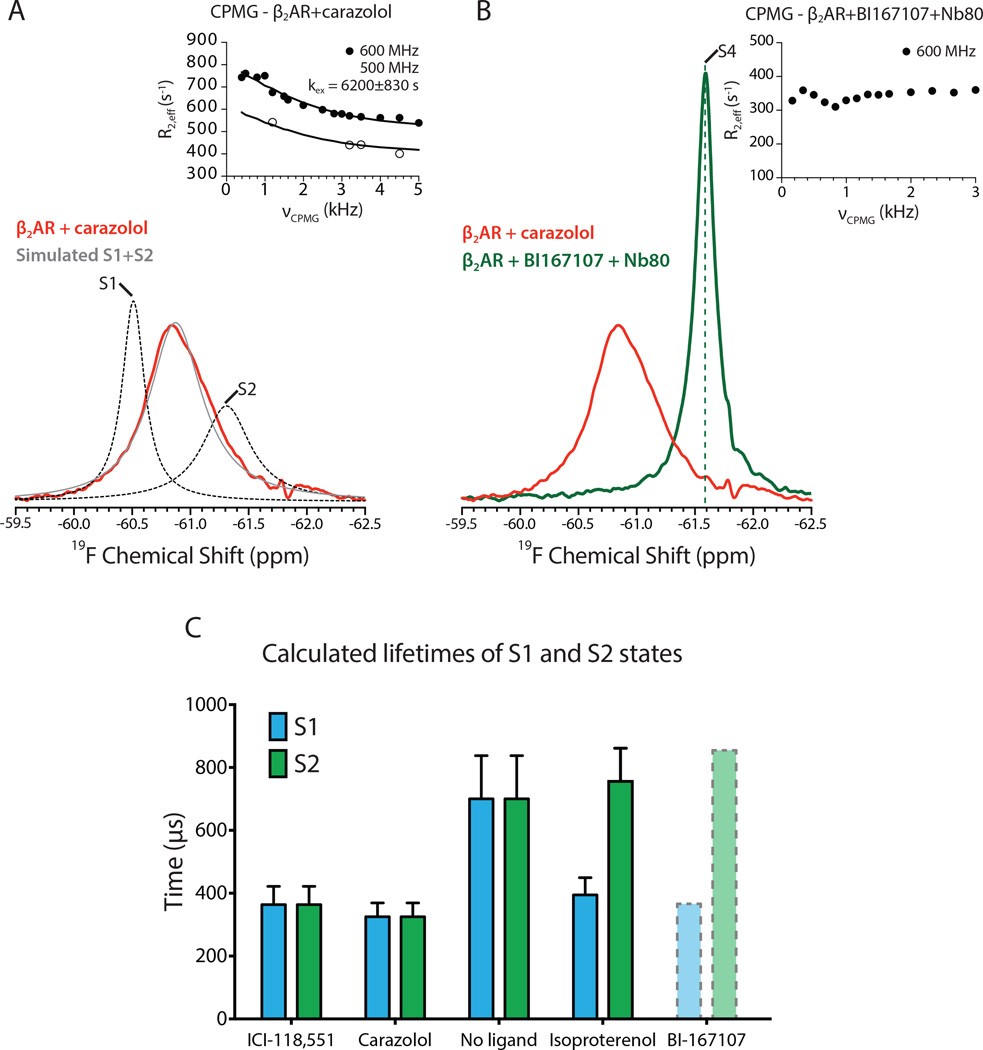
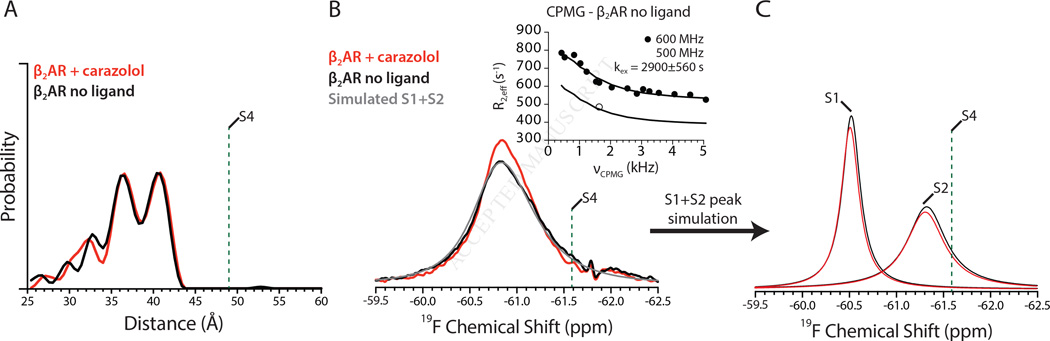
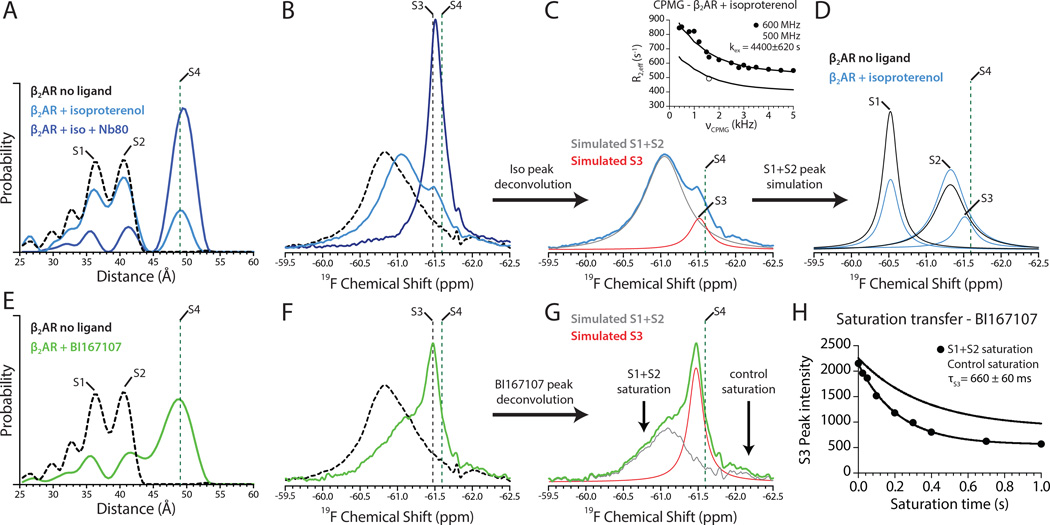
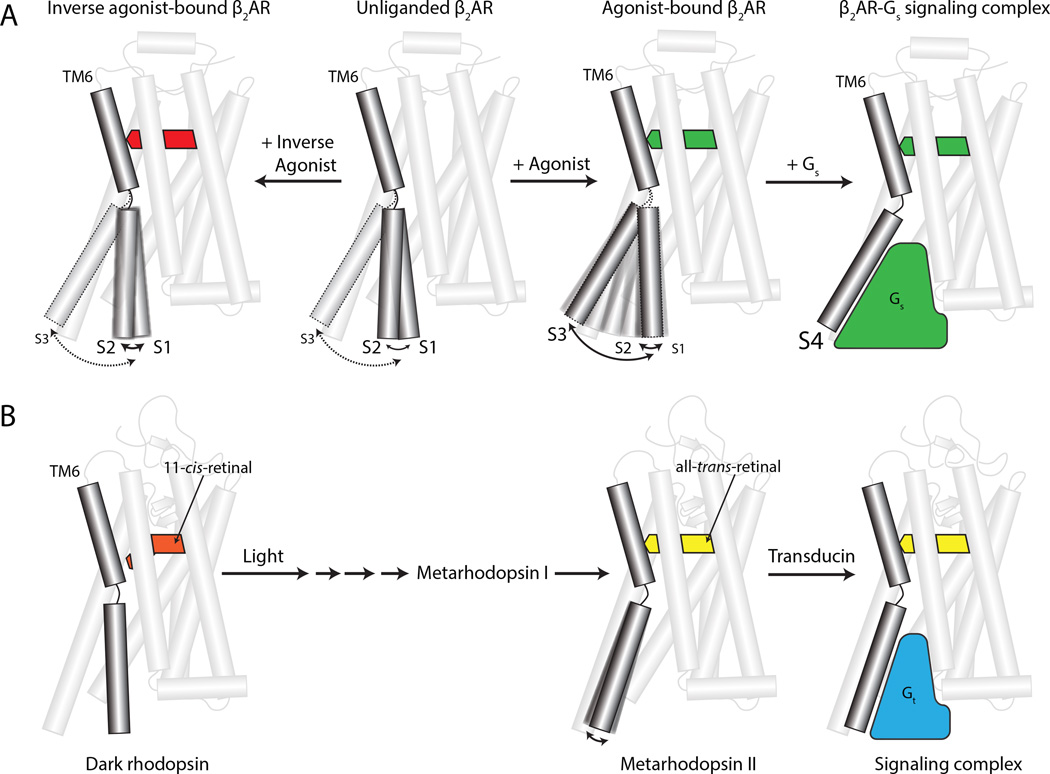
G-protein-coupled receptors (GPCRs) transduce signals from the extracellular environment to intracellular proteins. To gain structural insight into the regulation of receptor cytoplasmic conformations by extracellular ligands during signaling, we examine the structural dynamics of the cytoplasmic domain of the β2-adrenergic receptor (β2AR) using (19)F-fluorine NMR and double electron-electron resonance spectroscopy. These studies show that unliganded and inverse-agonist-bound β2AR exists predominantly in two inactive conformations that exchange within hundreds of microseconds. Although agonists shift the equilibrium toward a conformation capable of engaging cytoplasmic G proteins, they do so incompletely, resulting in increased conformational heterogeneity and the coexistence of inactive, intermediate, and active states. Complete transition to the active conformation requires subsequent interaction with a G protein or an intracellular G protein mimetic. These studies demonstrate a loose allosteric coupling of the agonist-binding site and G-protein-coupling interface that may generally be responsible for the complex signaling behavior observed for many GPCRs.


Figures

Figure 1
Figure 1
Spectroscopic methods for detecting conformational changes of β2AR. (A) Comparison of crystal structures of inactive, carazolol-bound and active β2AR in complex with agonist BI167107 and Gs. The crystal structures reveal a 14 Å outward displacement of TM6 upon β2AR activation. Cys265, used for 19F-NMR experiments is highlighted in spheres. (B) 19F-NMR studies utilize the fluorine label 2-bromo-4-(trifluoromethyl)acetanilide (19F-BTFA) that reports changes in the chemical environment at the cytoplasmic end of TM6. See Figure S1 and Table S1 for construct design and validation. (C) For DEER spectroscopy, β2AR was labeled at the cytoplasmic ends of TM4 (site N148C-IAP) and TM6 (site L266C-IAP) with the nitroxide label 3-(2-iodoacetamido)-2,2,5,5-tetramethylpyrroline-1-oxyl (IA-PROXYL). (D) Energy landscape of β2AR in the presence of inverse agonists carazolol and ICI-118,551, agonists isoproterenol and BI167107, and agonists with Nb80.
Figure 2
Figure 2
DEER distances of inactive and fully active β2AR. See Figure S2 for raw DEER data. (A) Distance distribution for carazolol-bound β2AR. The dotted lines show simulated nitroxide spin label distance distributions for a state with a broken ionic lock using carazolol-bound β2AR (PDB ID: 4GBR), and a state with an ionic lock intact using β1AR (PDB ID: 2YCW) as shown in panels B and C. (B) IA-PROXYL rotamers modeled onto β2AR bound to carazolol (PDB ID: 4GBR) using MTSSLWizard. The distance between these possible rotamers is then determined in a pairwise manner to yield the predicted distance distribution shown in A. (C) Similar analysis as in B was performed on the structure of β1AR bound to carazolol but with an intact ionic lock. The red outline indicates rotamers modeled in B. The mean distance for a state with an intact ionic lock is predicted to be shorter than for β2AR with a broken ionic lock. (D) Distance distribution for β2AR bound to BI167107 and Nb80. The dashed green line serves as a marker for the S4 state. The grey line represents the simulated distance distribution for β2AR bound to BI167107 and Nb80 using the previously determined crystal structure (PDB ID: 3P0G) as shown in panel E. (E) IA-PROXYL rotamer modeling of activated β2AR bound to BI167107 and Nb80.
Figure 3
Figure 3
19F-NMR spectra of inactive and fully active β2AR. See Figure S3 for raw NMR data. (A) 19F-NMR spectrum of carazolol-bound β2AR. The inset shows the presence of fast timescale dynamics as assessed by CPMG relaxation dispersion profiles at two magnetic fields (500 MHz and 600 MHz). The simulated S1 and S2 peaks in the absence of exchange are shown in dotted lines and the simulated combined lineshape arising from exchange of S1 and S2 is shown in grey. The simulated lineshapes are further illustrated in Figure S3. The estimated errors in R2,eff for CPMG studies are smaller than the graphics used for illustration. S tandard errors in kex are dependent on errors in R2,eff, which were estimated by the spectral noise and variation in spectra between experiments from identically prepared samples. See Extended Experimental Methods for more details. (B)19F-NMR spectrum of β2AR bound to BI167107 and Nb80. The dashed green line serves as a marker for the S4 state. Inset shows the absence of CPMG relaxation dispersion for β2AR bound to BI167107 and Nb80. (C) Lifetimes of the S1 and S2 states for β2AR were calculated using the measured exchange rates and the populations estimated by lineshape simulation. As the kex could not be experimentally determined for β2AR bound to BI167107, there is potential for error in the simulated populations and lifetimes. The data is therefore illustrated in dotted lines. Error bars represent errors propagated from CPMG fits and determination of S1 and S2 populations. Generally, inverse agonists decrease the lifetime of both the S1 and S2 states, while agonists decrease the lifetime of the S1 state while preserving the lifetime of the S2 state.
Figure 4
Figure 4
Spectroscopic insights into basal activity of unliganded β2AR. (A) DEER derived distance distributions for unliganded β2AR with the carazolol-bound distribution superimposed. See Figure S3 for DEER data with ICI-118,551. (B)19F-NMR spectra of unliganded β2AR with CPMG relaxation dispersions shown in the inset. The simulated lineshape for unliganded β2AR is shown in grey. (C) 19F-NMR simulated S1 and S2 states for unliganded β2AR compared to carazolol-bound β2AR.
Figure 5
Figure 5
Agonists induce conformational heterogeneity in the cytoplasmic domain of β2AR. (A) Distance distributions for β2AR in the presence of isoproterenol alone and with Nb80. The dashed black trace represents the distribution from unliganded β2AR. DEER experiments do not provide sufficient resolution to distinguish S3 from S4. (B) NMR spectrum of isoproterenol-bound β2AR shows the presence of a new upfield peak corresponding to S3 (−61.47 ppm) as well as a peak originating from fast exchange of S1 and S2 states. Addition of Nb80 causes a transition to a peak between the S3 and S4 states (−61.51 ppm). The S4 state has a chemical shift of −61.59 ppm. See Figure S5 for isoproterenol lineshape analysis. (C) Deconvolution of β2AR+isoproterenol without Nb80 to highlight the S3 state. CPMG dispersion of the S1+S2 peak is shown in the inset. (D) Simulation of S1 and S2 states for β2AR bound to isoproterenol and comparison with unliganded β2AR shows an increase in the S2 state for isoproterenol-bound receptor. (E) DEER distance distribution for β2AR bound to BI167107. (F) 19F-NMR spectrum of β2AR bound to BI167107, with a new peak at S3 (−61.47 ppm). (G) Deconvolution of β2AR+BI167107 spectrum into S1+S2 and S3 peaks. Arrows indicate positions of the spectrum irradiated in saturation transfer experiments with the resulting decay in signal shown in (H). See Figure S5 for saturation transfer NMR spectra. (A–G) Dashed green lines indicate the conformational signals observed for β2AR bound to BI167107 and Nb80.
Figure 6
Figure 6
Differences in the dynamic character of rhodopsin and β2AR. (A) The β2AR is conformationally dynamic in the inactive state, and agonists induce further dynamics to varying degree. The active state is only stabilized in the presence of either G protein or a G protein mimetic. Inverse agonists increase the rate of exchange between ionic lock intact (S1) and broken (S2) states, thereby reducing the lifetime of both states. (B) Dark rhodopsin is minimally dynamic due to the highly efficacious inverse agonist 11-cis-retinal. Illumination by light induces a conformational change to Metarhodopsin II and an accompanying outward displacement of TM6. This active state is then recognized by the G protein transducin (Gt).

References

    1. Altenbach C, Kusnetzow AK, Ernst OP, Hofmann KP, Hubbell WL. High-resolution distance mapping in rhodopsin reveals the pattern of helix movement due to activation. Proceedings of the National Academy of Sciences of the United States of America. 2008;105:7439–7444. - PMC - PubMed
    1. Arnis S, Hofmann KP. Two different forms of metarhodopsin II: Schiff base deprotonation precedes proton uptake and signaling state. Proceedings of the National Academy of Sciences of the United States of America. 1993;90:7849–7853. - PMC - PubMed
    1. Baker JG. The selectivity of beta-adrenoceptor antagonists at the human beta1, beta2 and beta3 adrenoceptors. British journal of pharmacology. 2005;144:317–322. - PMC - PubMed
    1. Baldwin AJ, Kay LE. NMR spectroscopy brings invisible protein states into focus. Nature chemical biology. 2009;5:808–814. - PubMed
    1. Cherezov V, Rosenbaum DM, Hanson MA, Rasmussen SG, Thian FS, Kobilka TS, Choi HJ, Kuhn P, Weis WI, Kobilka BK, et al. High-resolution crystal structure of an engineered human beta2-adrenergic G protein-coupled receptor. Science. 2007;318:1258–1265. - PMC - PubMed

Publication types

MeSH terms