. 2015 Jul;10(4):468.
doi: 10.1007/s12263-015-0468-0. Epub 2015 May 19.

Iron deficiency upregulates Egr1 expression

Affiliations

Iron deficiency upregulates Egr1 expression

Seung-Min Lee et al. Genes Nutr. 2015 Jul.

Abstract

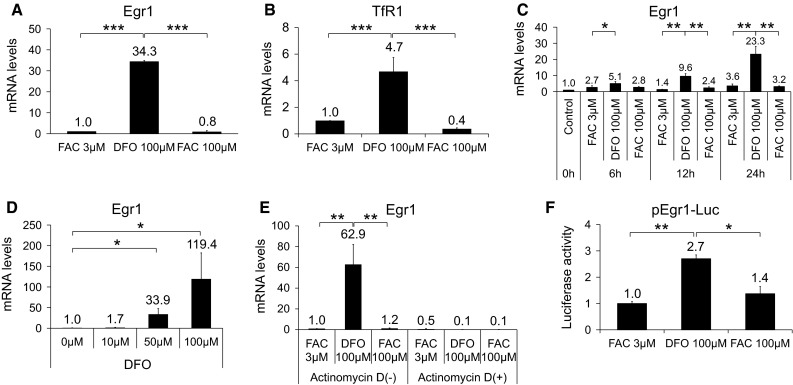
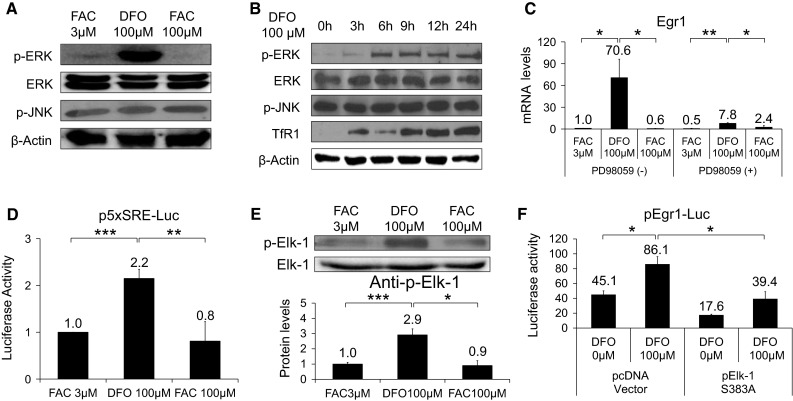
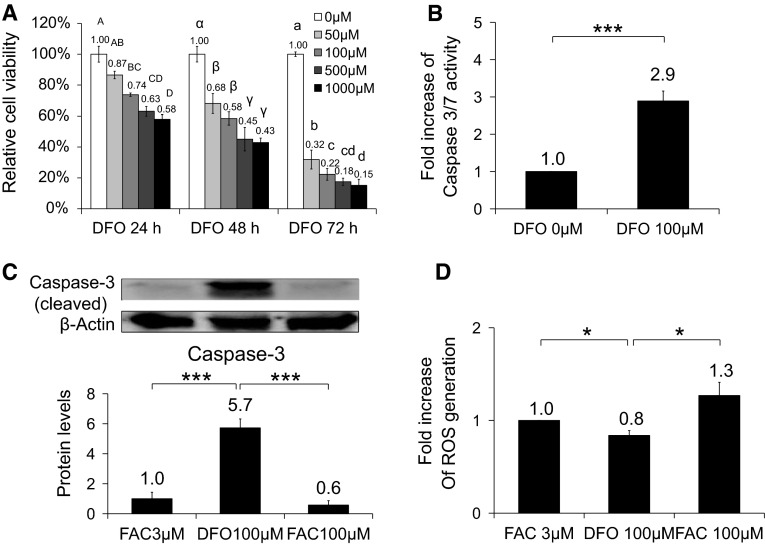
Iron-deficient anemia is a prevalent disease among humans. We searched for genes regulated by iron deficiency and its regulated mechanism. cDNA microarrays were performed using Hepa1c1c7 cells treated with 100 μM desferrioxamine (DFO), an iron chelator. Early growth response 1 (Egr1) was upregulated with at least 20-fold increase within 4 h and lasted for 24 h, which was confirmed by qRT-PCR. This activation was not seen by ferric ammonium citrate (FAC). DFO increased the transcriptional activity of Egr1-luc (-604 to +160) and serum response element (SRE)-luc reporters by 2.7-folds. In addition, cycloheximide lowered DFO-induced Egr1 mRNA levels. The upregulation of Egr1 by DFO was accompanied by sustained ERK signals along with phosphorylation of Elk-1. The ERK inhibitor (PD98059) prevented the DFO-induced Egr1 mRNAs. Overexpression of Elk-1 mutant (pElk-1S383A) decreased Egr1 reporter activity. DFO lowered reactive oxygen species (ROS) production and increased caspase 3/7 activity and cell death. DFO-induced iron deficiency upregulates Egr1 in part through transcriptional activation via ERK and Elk-1 signals, which may be important in the regulation of cell death in hepatoma cells. Our study demonstrated that iron depletion controlled the expression of Egr1, which might contribute to decisions about cellular fate in response to iron deficiency.


Figures

Fig. 1
Fig. 1
Effects of DFO on Egr1 mRNA and transcriptional activity. Egr1 (a) and TfR1 (b) mRNA in cells treated with 3 or 100 μM FAC or 100 μM DFO for 24 h. Changes in Egr1 transcripts over 24 h after DFO addition (c). Changes in Egr1 mRNA with DFO at 0, 10, 50, 100 μM for 24 h (d). Egr1 mRNA in presence or absence of actinomycin d (2.5 μg/ml) for 1 h before addition of 3 or 100 μM FAC or 100 μM DFO (e). Relative luciferase activity of Egr1-luc from −604 to +160 for cells incubated with 3 or 100 μM FAC or 100 μM DFO (f). Except Fig. 1c, all the treatments were done for 24 h. Data are expressed as degree of induction over control and are mean ± SE. Student’s t test was performed between the groups. *p < 0.05, **p < 0.01, ***p < 0.001. All experiments were performed at least three independent times
Fig. 2
Fig. 2
Effects of DFO on phosphorylation of ERK and Elk-1. Phosphorylated protein levels of ERK (p-ERK) and JNK (p-JNK) (a) and Elk (p-Elk) (e) in cells treated with 3 or 100 μM FAC or 100 μM DFO. Time course changes in p-ERK, ERK, p-JNK and TfR1 in cells incubated with 100 μM DFO (b). Egr1 mRNA from cells pretreated with or without PD98059 in the presence of 3 or 100 μM FAC or 100 μM DFO (c). Cells were transfected with 500 ng of p5X SRE reporter and 100 ng of pRLSV40. Next day transfection medium was changed with complete medium. The cells were stimulated with 3 or 100 μM FAC or 100 μM DFO for 24 h. Afterward, the cells were lysed and measured for luciferase activity (d). Cells were transfected with 250 ng of pEgr1-luc, 50 ng of pRLSV40 and 100 ng of pElk-1 S383A or empty vector. In following day, the cells were treated with vehicle or 100 μM DFO for 24 h. Relative luciferase activities in lysed cells were measured (f). Data are expressed as degree of induction over control and are mean ± SE. Student’s t test was performed between the groups. *p < 0.05, **p < 0.01, ***p < 0.001. All experiments were performed at least three independent times
Fig. 3
Fig. 3
Effects of DFO on cell viability, ROS levels and caspase 3/7 activation. a Viability of cells treated with DFO 0, 50, 100, 500, or 100 μM for 24, 48 or 72 h measured by MTT assay. b ROS levels detected by incubation with DCFH-DA (b) and the protein levels of cleaved form of caspase 3 (c) in cells treated with FAC 3 or 100 μM or DFO 100 μM for 24 h. Levels of caspase 3/7 activation in cells either untreated or treated with 100 μM DFO, which were measured using caspase 3/7-Glo assay kit (d). Values not sharing the same letter were significantly different (p < 0.05) by ANOVA. Student’s t test was performed between the groups. *p < 0.05, ***p < 0.001. All experiments were performed at least three independent times

References

    1. Akutagawa O, et al. Early growth response-1 mediates downregulation of telomerase in cervical cancer. Cancer Sci. 2008;99(7):1401–1406. doi: 10.1111/j.1349-7006.2008.00835.x. - DOI - PMC - PubMed
    1. Casey JL, et al. Iron-responsive elements: regulatory RNA sequences that control mRNA levels and translation. Science. 1988;240(4854):924–928. doi: 10.1126/science.2452485. - DOI - PubMed
    1. Cavigelli M, et al. Induction of c-fos expression through JNK-mediated TCF/Elk-1 phosphorylation. EMBO J. 1995;14(23):5957–5964. - PMC - PubMed
    1. Chan DA, et al. Role of prolyl hydroxylation in oncogenically stabilized hypoxia-inducible factor-1alpha. J Biol Chem. 2002;277(42):40112–40117. doi: 10.1074/jbc.M206922200. - DOI - PubMed
    1. Collins JF, et al. Identification of differentially expressed genes in response to dietary iron deprivation in rat duodenum. Am J Physiol Gastrointest Liver Physiol. 2005;288(5):G964–G971. doi: 10.1152/ajpgi.00489.2004. - DOI - PubMed

LinkOut - more resources