. 2015 Jul 1;27(25):3760-6.
doi: 10.1002/adma.201500889. Epub 2015 May 15.

High broad-band photoresponsivity of mechanically formed InSe-graphene van der Waals heterostructures

Affiliations

High broad-band photoresponsivity of mechanically formed InSe-graphene van der Waals heterostructures

Garry W Mudd et al. Adv Mater. .

Abstract

High broad-band photoresponsivity of mechanically formed InSe-graphene van der Waals heterostructures is achieved by exploiting the broad-band transparency of graphene, the direct bandgap of InSe, and the favorable band line up of InSe with graphene. The photoresponsivity exceeds that for other van der Waals heterostructures and the spectral response extends from the near-infrared to the visible spectrum.

Keywords: graphene; indium selenide; photoconductivity; van der Waals crystals.


Figures

Figure 1
Figure 1
a) Optical image and schematic structure of a graphene–n‐InSe–graphene planar device on a gated SiO2/Si substrate. b) Current–voltage, I–V s, characteristics in the dark at T = 300 K at various gate voltages, V g. The inset shows the V g‐dependence of the current through each graphene electrode, g1 and g2. This is measured using separate Au‐contacts on each graphene layer under an applied bias of 0.1 V. c) Temporal dependence of the dark current modulated by an AC square bias V s signal of frequency f = 100 Hz and amplitude of 1 V (V g = 0 V).
Figure 2
Figure 2
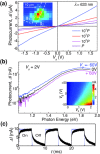
a) Photocurrent ΔI versus V s at T = 300 K and V g = 0 V under light illumination with a focused laser beam of power P, 102 P, 103 P, and 104 P (P = 0.5 nW, λ = 633 nm). The inset shows the photocurrent map indicating that ΔI arises primarily from the InSe layer between the two graphene electrodes, g1 and g2. b) Photoconductivity spectra at T = 300 K and V s = 2 V with unfocused light and power P ≈ 10 pW. The inset shows a color map of ΔI versus V g and V s with a laser at λ = 633 nm. c) Temporal dependence of the photocurrent (V g = 0 V, V s = 1 V, and λ = 633 nm). The dashed line shows the modulation of the laser beam at frequency f = 100 Hz.
Figure 3
Figure 3
a) Energy bands for isolated graphene and InSe layers with electron affinities of χ = −4.5 and −4.6 eV, respectively, and a bandgap energy for InSe of E g = 1.26 eV at 300 K. The Fermi level, E F, is shown for graphene at the neutrality point and for n‐InSe at 0.21 eV below the conduction band (CB) minimum. b) Band alignment at equilibrium (V s = 0) under various applied gate voltages V g. For V g > 0, the Fermi level of graphene raises toward the Dirac point and electrons tend to diffuse into the InSe layer; as the concentration of holes (induced by a negative gate voltage) increases, the Fermi level in graphene moves closer to that of InSe and electrons retreat from InSe.
Figure 4
Figure 4
a) Photoresponsivity versus incident laser power at T = 300 K and λ = 633 nm for planar device geometries based on graphene/InSe/graphene (top) and Au/InSe/Au heterostructures (bottom) (V s = 2 V and V g = 0 V). The inset sketches the band alignment for the two heterostructures at V s = 0 V. b) Work functions (φ) for Au and InSe, and the electron affinity (χ) of graphene.
Figure 5
Figure 5
Schematic structure of graphene–n‐InSe–graphene vertical devices of a) type A and b) type B. c) Left: Optical images of device A showing the heterostructure before and after deposition of the Au‐contacts. The graphene layers, g1 and g2, are separated by an InSe flake of thickness t = 27 nm and overlap over a small region shown by the square. Right: Dark current, I, and photocurrent, ΔI, versus V s at T = 300 K for device A. The photocurrent is measured with a laser beam of power P, 10P, 102 P, 103 P, and 104P (P = 40 fW, λ = 633 nm, T = 300 K). d) Photo­responsivity versus laser power at T = 300 K and λ = 633 nm for device A (blue) and devices of type B (magenta). Devices B1 and B2 are based on InSe flakes of thickness t = 130 and 80 nm, respectively. The line is a fit to data for device A by an empirical power law, i.e., RP−n, where n = 2/3. The inset shows a photocurrent map superimposed onto the optical image of device A.

References

    1. Geim A. K., Grigorieva I. V, Nature 2013, 499, 419. - PubMed
    1. Novoselov K. S., Rev. Mod. Phys. 2011, 83, 837.
    1. Britnell L., Ribeiro R. M., Eckmann A., Jalil R., Belle B. D., Mishchenko A., Kim Y. J., Gorbachev R. V., Georgiou T., Morozov S. V., Grigorenko A. N., Geim A. K., Casiraghi C., Castro Neto A. H., Novoselov K. S., Science 2013, 340, 1311. - PubMed
    1. Georgiou T., Jalil R., Belle B. D., Britnell L., Gorbachev R. V, Morozov S. V, Kim Y.‐J., Gholinia A., Haigh S. J., Makarovsky O., Eaves L., a Ponomarenko L., Geim A. K., Novoselov K. S., Mishchenko A., Nat. Nanotechnol. 2013, 8, 100. - PubMed
    1. Mishchenko A., Tu J. S., Cao Y., Gorbachev R. V., Wallbank J. R., Greenaway M. T., Morozov V. E., Morozov S. V., Zhu M. J., Wong S. L., Withers F., Woods C. R., Kim Y‐J., Watanabe K., Taniguchi T., Vdovin E. E., Makarovsky O., Fromhold T. M., Falko V. I., Geim A. K., Eaves L., Novoselov K. S., Nat. Nanotechnol. 2014, 9, 808. - PubMed