

Expanding the spectrum of neuronal pathology in multiple system atrophy
- PMID: 25981961
- PMCID: PMC4840945
- DOI: 10.1093/brain/awv114
Expanding the spectrum of neuronal pathology in multiple system atrophy
Abstract
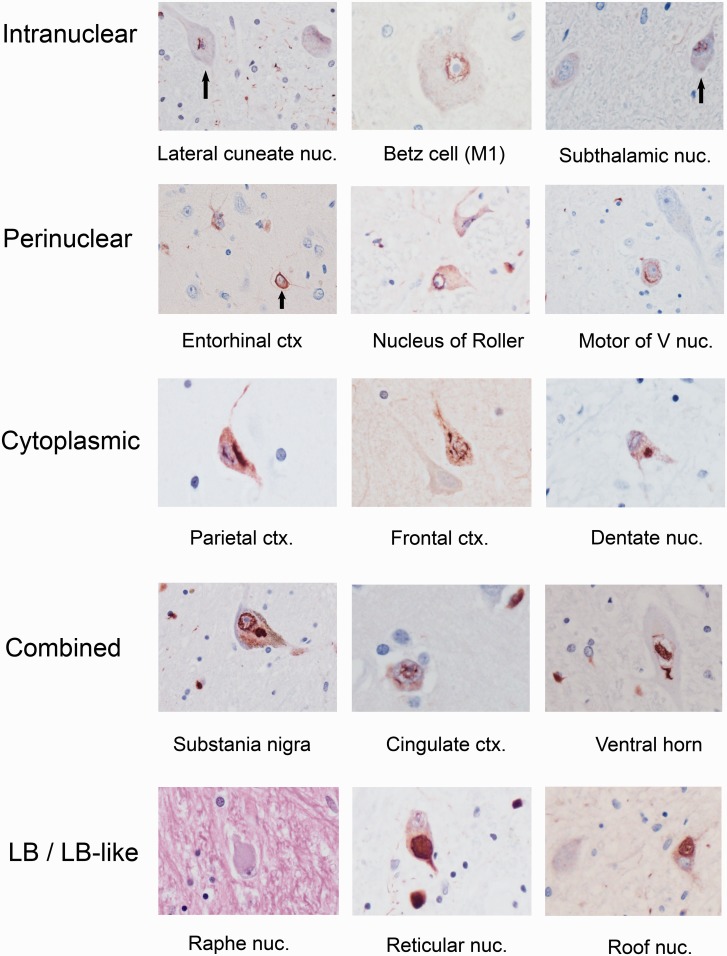
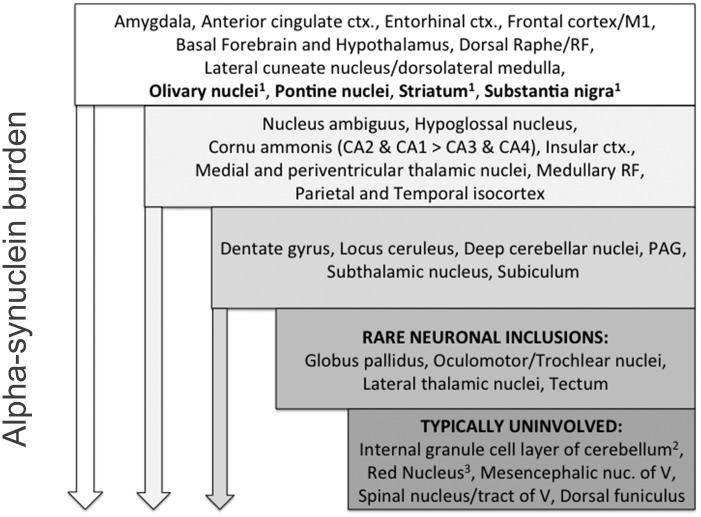
Multiple system atrophy is a sporadic alpha-synucleinopathy that typically affects patients in their sixth decade of life and beyond. The defining clinical features of the disease include progressive autonomic failure, parkinsonism, and cerebellar ataxia leading to significant disability. Pathologically, multiple system atrophy is characterized by glial cytoplasmic inclusions containing filamentous alpha-synuclein. Neuronal inclusions also have been reported but remain less well defined. This study aimed to further define the spectrum of neuronal pathology in 35 patients with multiple system atrophy (20 male, 15 female; mean age at death 64.7 years; median disease duration 6.5 years, range 2.2 to 15.6 years). The morphologic type, topography, and frequencies of neuronal inclusions, including globular cytoplasmic (Lewy body-like) neuronal inclusions, were determined across a wide spectrum of brain regions. A correlation matrix of pathologic severity also was calculated between distinct anatomic regions of involvement (striatum, substantia nigra, olivary and pontine nuclei, hippocampus, forebrain and thalamus, anterior cingulate and neocortex, and white matter of cerebrum, cerebellum, and corpus callosum). The major finding was the identification of widespread neuronal inclusions in the majority of patients, not only in typical disease-associated regions (striatum, substantia nigra), but also within anterior cingulate cortex, amygdala, entorhinal cortex, basal forebrain and hypothalamus. Neuronal inclusion pathology appeared to follow a hierarchy of region-specific susceptibility, independent of the clinical phenotype, and the severity of pathology was duration-dependent. Neuronal inclusions also were identified in regions not previously implicated in the disease, such as within cerebellar roof nuclei. Lewy body-like inclusions in multiple system atrophy followed the stepwise anatomic progression of Lewy body-spectrum disease inclusion pathology in 25.7% of patients with multiple system atrophy, including a patient with visual hallucinations. Further, the presence of Lewy body-like inclusions in neocortex, but not hippocampal alpha-synuclein pathology, was associated with cognitive impairment (P = 0.002). However, several cases had the presence of isolated Lewy body-like inclusions at atypical sites (e.g. thalamus, deep cerebellar nuclei) that are not typical for Lewy body-spectrum disease. Finally, interregional correlations (rho ≥ 0.6) in pathologic glial and neuronal lesion burden suggest shared mechanisms of disease progression between both discrete anatomic regions (e.g. basal forebrain and hippocampus) and cell types (neuronal and glial inclusions in frontal cortex and white matter, respectively). These findings suggest that in addition to glial inclusions, neuronal pathology plays an important role in the developmental and progression of multiple system atrophy.
Keywords: Lewy body-like; alpha-synuclein; inclusion bodies; multiple system atrophy; neuropathology.
© The Author (2015). Published by Oxford University Press on behalf of the Guarantors of Brain. All rights reserved. For Permissions, please email: journals.permissions@oup.com.
Figures


Comment in
-
Re-evaluating the glio-centric view of multiple system atrophy by highlighting the neuronal involvement.Brain. 2015 Aug;138(Pt 8):2116-9. doi: 10.1093/brain/awv151. Brain. 2015. PMID: 26205836 No abstract available.
References
-
- Ahmed Z, Asi YT, Sailer A, Lees AJ, Houlden H, Revesz T, et al. The neuropathology, pathophysiology and genetics of multiple system atrophy. Neuropathol Appl Neurobiol 2012; 38: 4–24. - PubMed
-
- Arai N, Papp MI, Lantos PL. New observation on ubiquitinated neurons in the cerebral cortex of multiple system atrophy (MSA). Neurosci Lett 1994; 182: 197–200. - PubMed
-
- Arima K, Murayama S, Mukoyama M, Inose T. Immunocytochemical and ultrastructural studies of neuronal and oligodendroglial cytoplasmic inclusions in multiple system atrophy. 1. Neuronal cytoplasmic inclusions. Acta Neuropathol 1992; 83: 453–60. - PubMed
-
- Armstrong RA, Cairns NJ, Lantos PL. A quantitative study of the pathological changes in ten patients with multiple system atrophy (MSA). J Neural Transm 2004; 111: 485–95. - PubMed
-
- Asi YT, Ling H, Ahmed Z, Lees AJ, Revesz T, Holton JL. Neuropathological features of multiple system atrophy with cognitive impairment. Mov Disord 2014; 29: 884–8. - PubMed
Publication types
MeSH terms
Substances
Grants and funding
LinkOut - more resources
Full Text Sources
Other Literature Sources
