

Financing universal health coverage--effects of alternative tax structures on public health systems: cross-national modelling in 89 low-income and middle-income countries
- PMID: 25982041
- PMCID: PMC4513966
- DOI: 10.1016/S0140-6736(15)60574-8
Financing universal health coverage--effects of alternative tax structures on public health systems: cross-national modelling in 89 low-income and middle-income countries
Abstract
Background: How to finance progress towards universal health coverage in low-income and middle-income countries is a subject of intense debate. We investigated how alternative tax systems affect the breadth, depth, and height of health system coverage.
Methods: We used cross-national longitudinal fixed effects models to assess the relationships between total and different types of tax revenue, health system coverage, and associated child and maternal health outcomes in 89 low-income and middle-income countries from 1995-2011.
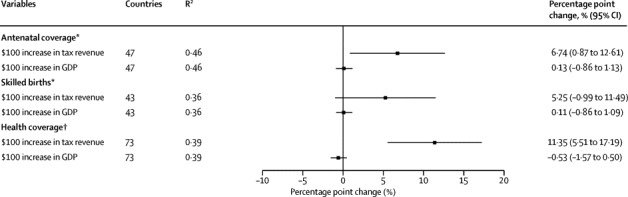
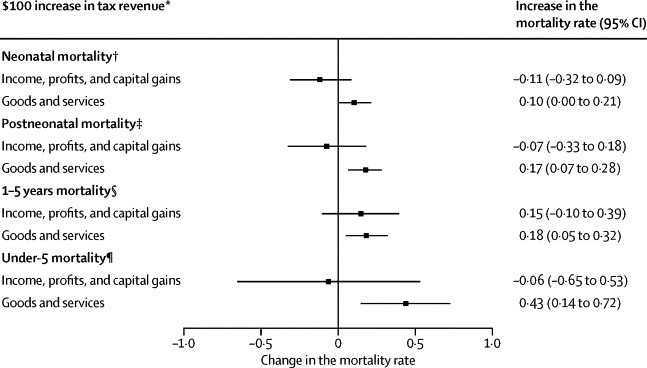
Findings: Tax revenue was a major statistical determinant of progress towards universal health coverage. Each US$100 per capita per year of additional tax revenues corresponded to a yearly increase in government health spending of $9.86 (95% CI 3.92-15.8), adjusted for GDP per capita. This association was strong for taxes on capital gains, profits, and income ($16.7, 9.16 to 24.3), but not for consumption taxes on goods and services (-$4.37, -12.9 to 4.11). In countries with low tax revenues (<$1000 per capita per year), an additional $100 tax revenue per year substantially increased the proportion of births with a skilled attendant present by 6.74 percentage points (95% CI 0.87-12.6) and the extent of financial coverage by 11.4 percentage points (5.51-17.2). Consumption taxes, a more regressive form of taxation that might reduce the ability of the poor to afford essential goods, were associated with increased rates of post-neonatal mortality, infant mortality, and under-5 mortality rates. We did not detect these adverse associations with taxes on capital gains, profits, and income, which tend to be more progressive.
Interpretation: Increasing domestic tax revenues is integral to achieving universal health coverage, particularly in countries with low tax bases. Pro-poor taxes on profits and capital gains seem to support expanding health coverage without the adverse associations with health outcomes observed for higher consumption taxes. Progressive tax policies within a pro-poor framework might accelerate progress toward achieving major international health goals.
Funding: Commission of the European Communities (FP7-DEMETRIQ), the European Union's HRES grants, and the Wellcome Trust.
Copyright © 2015 Reeves et al. Open Access article distributed under the terms of CC BY. Published by Elsevier Ltd.. All rights reserved.
Figures

Comment in
-
Universal health coverage: progressive taxes are key.Lancet. 2015 Jul 18;386(9990):227-9. doi: 10.1016/S0140-6736(15)60868-6. Epub 2015 May 14. Lancet. 2015. PMID: 25982039 No abstract available.
-
Tax, aid, and health expenditure.Lancet. 2015 Sep 19;386(9999):1133. doi: 10.1016/S0140-6736(15)00199-3. Lancet. 2015. PMID: 26461898 No abstract available.
References
-
- WHO . World health report 2013: Research for universal health coverage. World Health Organization; Geneva: 2013.
-
- WHO . Constitution of the World Health Organization. World Health Organization; Geneva: 2006.
-
- Chan M. Best days for public health are ahead of us. Address to the Sixty-fifth World Health Assembly. 21 May. World Health Organization; Geneva, Switzerland: 2012.
-
- WHO . Sixty-Fifth World Health Assembly. World Health Organization; Geneva: 2012.
Publication types
MeSH terms
Grants and funding
LinkOut - more resources
Full Text Sources
