

Comparable calcium handling of human iPSC-derived cardiomyocytes generated by multiple laboratories
- PMID: 25982839
- PMCID: PMC4530041
- DOI: 10.1016/j.yjmcc.2015.05.003
Comparable calcium handling of human iPSC-derived cardiomyocytes generated by multiple laboratories
Abstract
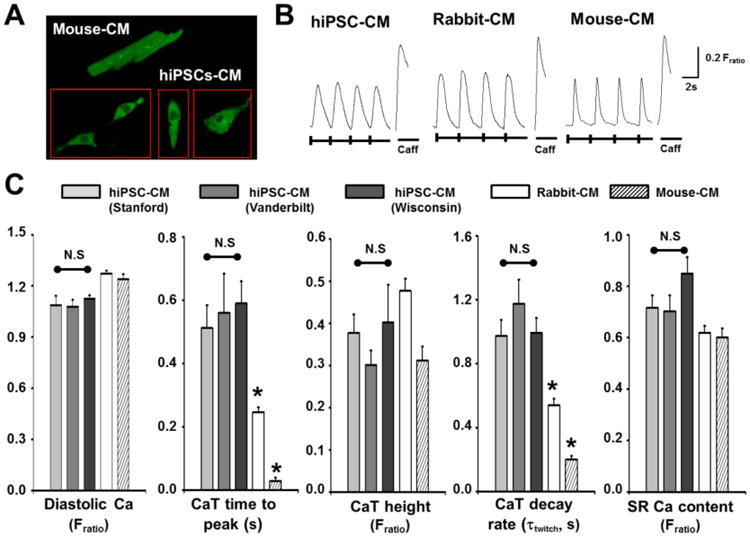
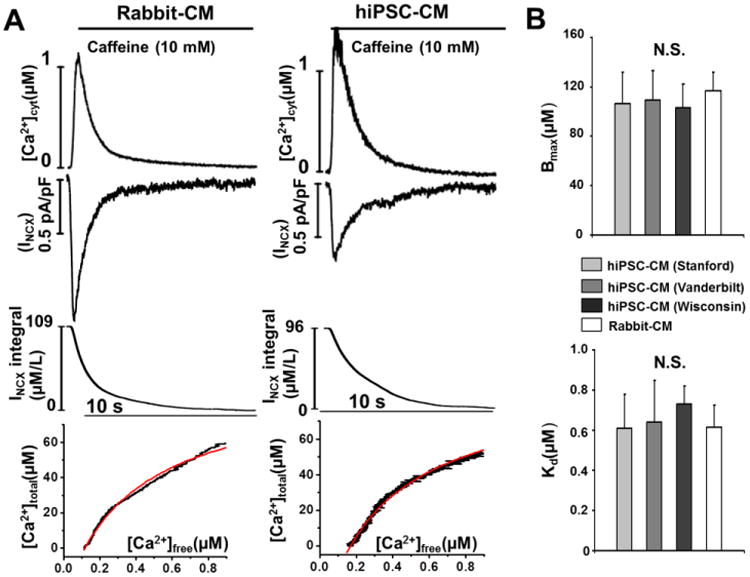
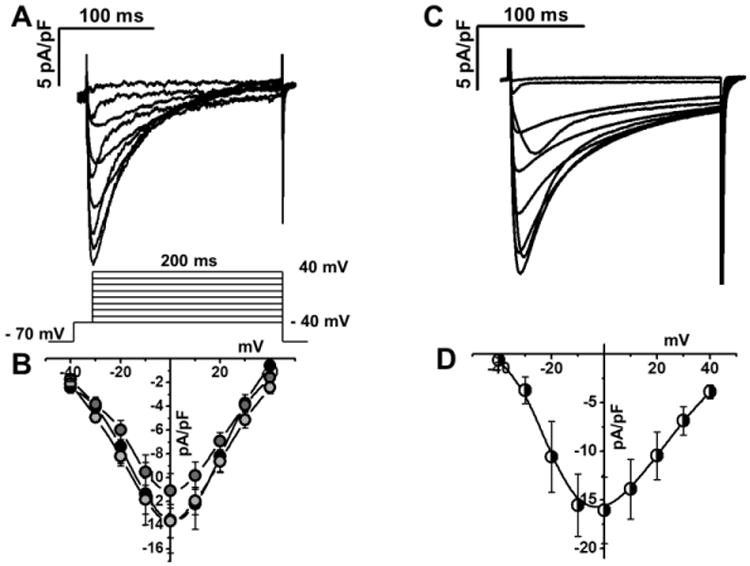
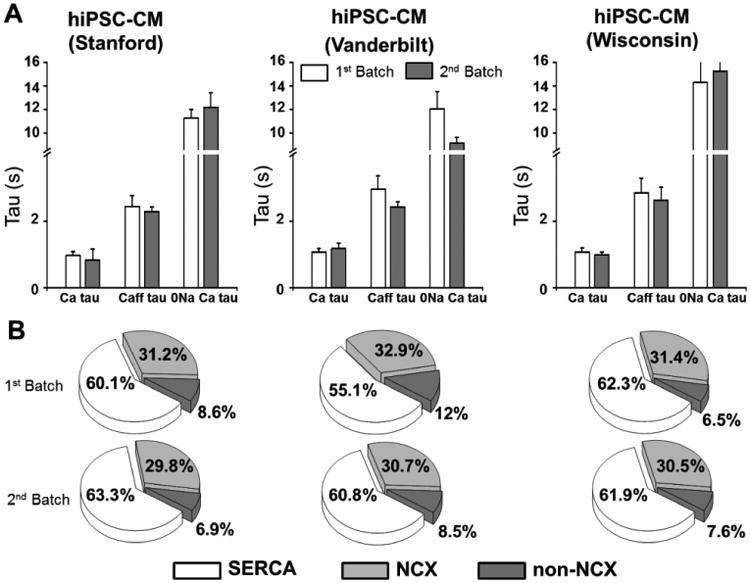
Cardiomyocytes (CMs) derived from human induced pluripotent stem cells (hiPSCs) are being increasingly used to model human heart diseases. hiPSC-CMs generated by earlier aggregation-based methods (i.e., embryoid body) often lack functional sarcoplasmic reticulum (SR) Ca stores characteristic of mature mammalian CMs. Newer monolayer-based cardiac differentiation methods (i.e., Matrigel sandwich or small molecule-based differentiation) produce hiPSC-CMs of high purity and yield, but their Ca handling has not been comprehensively investigated. Here, we studied Ca handling and cytosolic Ca buffering properties of hiPSC-CMs generated independently from multiple hiPSC lines at Stanford University, Vanderbilt University and University of Wisconsin-Madison. hiPSC-CMs were cryopreserved at each university. Frozen aliquots were shipped, recovered from cryopreservation, plated at low density and compared 3-5days after plating with acutely-isolated adult rabbit and mouse ventricular CMs. Although hiPSC-CM cell volume was significantly smaller, cell capacitance to cell volume ratio and cytoplasmic Ca buffering were not different from rabbit-CMs. hiPSC-CMs from all three laboratories exhibited robust L-type Ca currents, twitch Ca transients and caffeine-releasable SR Ca stores comparable to adult CMs. Ca transport by sarcoendoplasmic reticulum Ca ATPase (SERCA) and Na/Ca exchanger (NCX) was similar in all hiPSC-CM lines, but slower compared to rabbit-CMs. However, the relative contribution of SERCA and NCX to Ca transport of hiPSC-CMs was comparable to rabbit-CMs. Ca handling maturity of hiPSC-CMs increased from 15 to 21days post-induction. We conclude that hiPSC-CMs generated independently from multiple iPSC lines using monolayer-based methods can be reproducibly recovered from cryopreservation and exhibit comparable and functional SR Ca handling.
Copyright © 2015. Published by Elsevier Ltd.
Conflict of interest statement
Conflict of Interest: JCW is a co-founder of Stem Cell Theranostics, all other authors declare no conflict of interest.
Figures


Comment in
-
Induced pluripotent stem cell-derived cardiac myocytes to understand and test calcium handling: Pie in the sky?J Mol Cell Cardiol. 2015 Dec;89(Pt B):376-8. doi: 10.1016/j.yjmcc.2015.10.023. J Mol Cell Cardiol. 2015. PMID: 26695094 No abstract available.
-
Human induced pluripotent stem cell (hiPSC) derived cardiomyocytes to understand and test cardiac calcium handling: A glass half full.J Mol Cell Cardiol. 2015 Dec;89(Pt B):379-80. doi: 10.1016/j.yjmcc.2015.10.021. J Mol Cell Cardiol. 2015. PMID: 26695095 No abstract available.
References
-
- Takahashi K, Yamanaka S. Induction of pluripotent stem cells from mouse embryonic and adult fibroblast cultures by defined factors. Cell. 2006;126:663–76. - PubMed
-
- Takahashi K, Okita K, Nakagawa M, Yamanaka S. Induction of pluripotent stem cells from fibroblast cultures. Nat Protoc. 2007;2:3081–9. - PubMed
-
- Yamanaka S. Strategies and new developments in the generation of patient-specific pluripotent stem cells. Cell Stem Cell. 2007;1:39–49. - PubMed
Publication types
MeSH terms
Substances
Grants and funding
- HL104040/HL/NHLBI NIH HHS/United States
- R01 HL108173/HL/NHLBI NIH HHS/United States
- I01 BX000771/BX/BLRD VA/United States
- HL108173/HL/NHLBI NIH HHS/United States
- EY08126/EY/NEI NIH HHS/United States
- R01 HL088635/HL/NHLBI NIH HHS/United States
- P50 GM115305/GM/NIGMS NIH HHS/United States
- CA68485/CA/NCI NIH HHS/United States
- R01 NS078289/NS/NINDS NIH HHS/United States
- DK20593/DK/NIDDK NIH HHS/United States
- R01 HL071670/HL/NHLBI NIH HHS/United States
- HL71670/HL/NHLBI NIH HHS/United States
- UL1 RR024975/RR/NCRR NIH HHS/United States
- U01HL099773/HL/NHLBI NIH HHS/United States
- R01 HL104040/HL/NHLBI NIH HHS/United States
- DK58404/DK/NIDDK NIH HHS/United States
- R01 ES016931/ES/NIEHS NIH HHS/United States
- DK59637/DK/NIDDK NIH HHS/United States
- P30 DK020593/DK/NIDDK NIH HHS/United States
- HL88635/HL/NHLBI NIH HHS/United States
- UL1 TR000445/TR/NCATS NIH HHS/United States
LinkOut - more resources
Full Text Sources
Other Literature Sources
Research Materials
