

Increasing Prevalence of Myopia in Europe and the Impact of Education
- PMID: 25983215
- PMCID: PMC4504030
- DOI: 10.1016/j.ophtha.2015.03.018
Increasing Prevalence of Myopia in Europe and the Impact of Education
Abstract
Purpose: To investigate whether myopia is becoming more common across Europe and explore whether increasing education levels, an important environmental risk factor for myopia, might explain any temporal trend.
Design: Meta-analysis of population-based, cross-sectional studies from the European Eye Epidemiology (E(3)) Consortium.
Participants: The E(3) Consortium is a collaborative network of epidemiological studies of common eye diseases in adults across Europe. Refractive data were available for 61 946 participants from 15 population-based studies performed between 1990 and 2013; participants had a range of median ages from 44 to 78 years.
Methods: Noncycloplegic refraction, year of birth, and highest educational level achieved were obtained for all participants. Myopia was defined as a mean spherical equivalent ≤-0.75 diopters. A random-effects meta-analysis of age-specific myopia prevalence was performed, with sequential analyses stratified by year of birth and highest level of educational attainment.
Main outcome measures: Variation in age-specific myopia prevalence for differing years of birth and educational level.
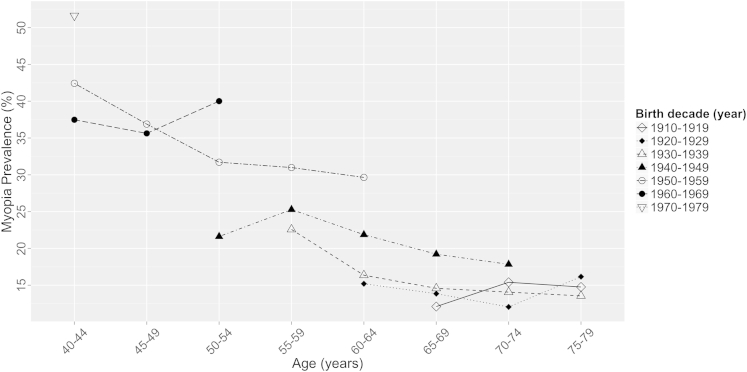
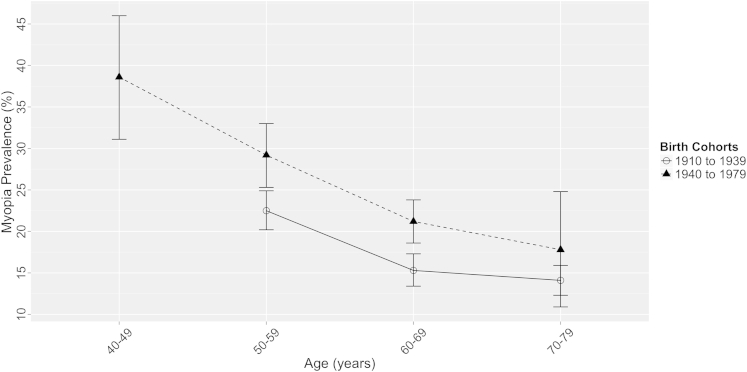
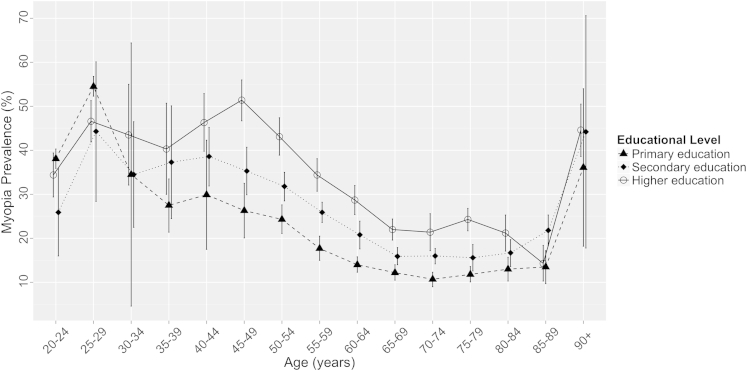
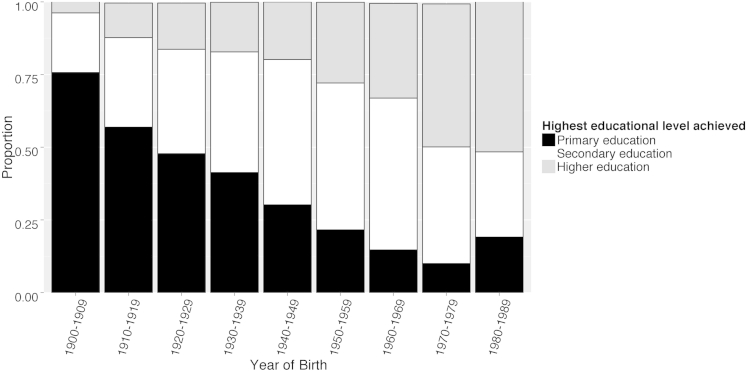
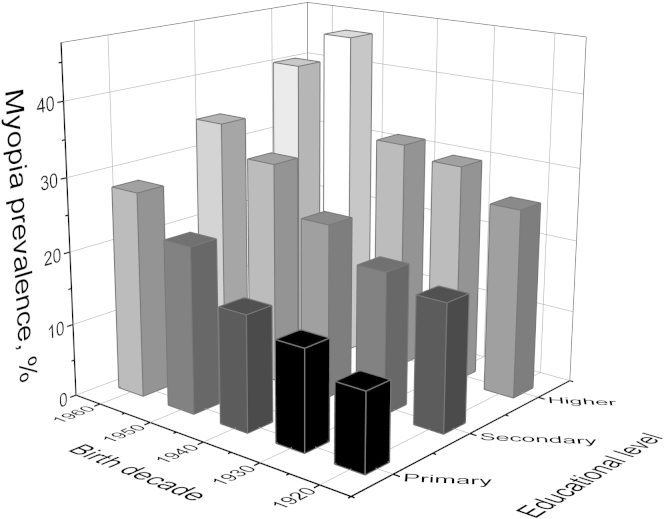
Results: There was a significant cohort effect for increasing myopia prevalence across more recent birth decades; age-standardized myopia prevalence increased from 17.8% (95% confidence interval [CI], 17.6-18.1) to 23.5% (95% CI, 23.2-23.7) in those born between 1910 and 1939 compared with 1940 and 1979 (P = 0.03). Education was significantly associated with myopia; for those completing primary, secondary, and higher education, the age-standardized prevalences were 25.4% (CI, 25.0-25.8), 29.1% (CI, 28.8-29.5), and 36.6% (CI, 36.1-37.2), respectively. Although more recent birth cohorts were more educated, this did not fully explain the cohort effect. Compared with the reference risk of participants born in the 1920s with only primary education, higher education or being born in the 1960s doubled the myopia prevalence ratio-2.43 (CI, 1.26-4.17) and 2.62 (CI, 1.31-5.00), respectively-whereas individuals born in the 1960s and completing higher education had approximately 4 times the reference risk: a prevalence ratio of 3.76 (CI, 2.21-6.57).
Conclusions: Myopia is becoming more common in Europe; although education levels have increased and are associated with myopia, higher education seems to be an additive rather than explanatory factor. Increasing levels of myopia carry significant clinical and economic implications, with more people at risk of the sight-threatening complications associated with high myopia.
Copyright © 2015 American Academy of Ophthalmology. Published by Elsevier Inc. All rights reserved.
Figures
Comment in
-
Re: Williams et al.: Increasing prevalence of myopia in Europe and the impact of education (Ophthalmology 2015;122:1489-97).Ophthalmology. 2016 Apr;123(4):e28-9. doi: 10.1016/j.ophtha.2015.11.014. Ophthalmology. 2016. PMID: 27012702 No abstract available.
-
Reply.Ophthalmology. 2016 Apr;123(4):e29. doi: 10.1016/j.ophtha.2015.11.016. Ophthalmology. 2016. PMID: 27012705 No abstract available.
References
-
- Morgan I.G., Ohno-Matsui K., Saw S.-M. Myopia. Lancet. 2012;379:1739–1748. - PubMed
-
- Pan C.W., Ramamurthy D., Saw S.M. Worldwide prevalence and risk factors for myopia. Ophthalmic Physiol Opt. 2012;32:3–16. - PubMed
-
- Bourne R.R., Stevens G.A., White R.A. Causes of vision loss worldwide, 1990—2010: a systematic analysis. Lancet Glob Health. 2013;1:e339–e349. - PubMed
-
- Group TEDPR The prevalence of refractive errors among adults in the United States, Western Europe, and Australia. Arch Ophthalmol. 2004;122:495–505. - PubMed
Publication types
MeSH terms
Grants and funding
LinkOut - more resources
Full Text Sources
Other Literature Sources
