. 2015 Apr 30:6:358.
doi: 10.3389/fmicb.2015.00358. eCollection 2015.

Reconstructing rare soil microbial genomes using in situ enrichments and metagenomics

Affiliations

Reconstructing rare soil microbial genomes using in situ enrichments and metagenomics

Tom O Delmont et al. Front Microbiol. .

Abstract

Despite extensive direct sequencing efforts and advanced analytical tools, reconstructing microbial genomes from soil using metagenomics have been challenging due to the tremendous diversity and relatively uniform distribution of genomes found in this system. Here we used enrichment techniques in an attempt to decrease the complexity of a soil microbiome prior to sequencing by submitting it to a range of physical and chemical stresses in 23 separate microcosms for 4 months. The metagenomic analysis of these microcosms at the end of the treatment yielded 540 Mb of assembly using standard de novo assembly techniques (a total of 559,555 genes and 29,176 functions), from which we could recover novel bacterial genomes, plasmids and phages. The recovered genomes belonged to Leifsonia (n = 2), Rhodanobacter (n = 5), Acidobacteria (n = 2), Sporolactobacillus (n = 2, novel nitrogen fixing taxon), Ktedonobacter (n = 1, second representative of the family Ktedonobacteraceae), Streptomyces (n = 3, novel polyketide synthase modules), and Burkholderia (n = 2, includes mega-plasmids conferring mercury resistance). Assembled genomes averaged to 5.9 Mb, with relative abundances ranging from rare (<0.0001%) to relatively abundant (>0.01%) in the original soil microbiome. Furthermore, we detected them in samples collected from geographically distant locations, particularly more in temperate soils compared to samples originating from high-latitude soils and deserts. To the best of our knowledge, this study is the first successful attempt to assemble multiple bacterial genomes directly from a soil sample. Our findings demonstrate that developing pertinent enrichment conditions can stimulate environmental genomic discoveries that would have been impossible to achieve with canonical approaches that focus solely upon post-sequencing data treatment.

Keywords: environmental genomics; metagenomics; phages; plasmids; rare biosphere; soil.


Figures

Figure 1
Figure 1
Graphs represent the relative distribution of 4 bacterial taxa using M5NR databases (A) and Pfams (B) in the 36 metagenomic datasets when annotated in MG-RAST. E-value cut-off was defined as 10-5. P-values were defined using distribution variations between conditions (Kruskal-Wallis test). X-axes identify different ESCs: C, control; 1, ethanol; 2, salt #1; 3, salt #2; 4, 37°C; 5, nitrogen; 6, diesel; 7, heavy metals #1; 8, heavy metals #2; 9, mercury #1; 10, mercury #2.
Figure 2
Figure 2
Panels (A,B) represent the relative percentage of assembled reads and longest reconstructed contig after assembling the 23 datasets, respectively. Panels (C,D) represent the number and percentage of genes longer than 1kb recovered from these assemblies, respectively. For (A–D), X-axes identify different ESCs. Finally, (E) represents a functional network linking the 23 assembled metagenomic datasets and the 24,291 distinct functions annotated from these assemblies. The network was generated using Gephi and Force Atlas 2 and represents a total of 85,188 connections. Datasets are colored and have a size depending on the number of different functions they are connected to. In all panels, ESCs represent the following conditions; C, control; 1, ethanol; 2, salt #1; 3, salt #2; 4, 37°C; 5, nitrogen; 6, diesel; 7, heavy metals #1; 8, heavy metals #2; 9, mercury #1; 10, mercury #2.
Figure 3
Figure 3
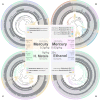
Panels (A–D) exhibit the metagenomic assemblies (genetic structures reaching 10 kb only) recovered from the Mercury enrichments 2 (19.5 Mb) and 1 (33.8 Mb), heavy metals enrichment 2 (12 Mb) and ethanol enrichment (10 Mb), respectively. We applied a mapping requirement of 97% identity to estimate coverage values. Genetic structures are organized in trees based on their tetranucleotide frequency (Euclidean distance) and were subsequently fragmented into sections of 20 kb displaying the same color in the first outer cycle. Therefore, each section in the tree represents a genetic structure ranging from 10 to 20 kb (length is displayed in the second outer cycle in black). Mean coverage (third outer cycle) and GC-content (forth outer cycle) are display for each section to assess the coherence of clusters. Finally, draft genomes determined from these assemblies are presented in the last outer cycle as well as in the tree itself.
Figure 4
Figure 4
Example of the two Burkholderia genomes reconstructed from the third replicate of mercury enrichment #2. Panels (A,B) represent replicons and mega-plasmid from Burkholderia Mer3-A and Mer3-B, respectively. Artemis and DNAPlotter were used to visualize the two replicons and mega-plasmid present in this microorganism. First (i.e., interior) and second circles represents GC skew and GC-content variations, respectively. Third circle represents the location of tRNAs (dark), conjugative (chestnut), and mercury (pink) related genes. Fourth and fifth circles represent genes of known (green) and unknown (blue) functions as well as genes related to flagellum (red) in the two possible frames.
Figure 5
Figure 5
Coverage of eight draft genomes (organized in a tree based on their tetranucleotide frequency (Euclidean distance) and fragmented into sections of 20 kb) in metagenomic data representing seven microcosms and four incubation conditions. The data was generated during the first sequencing effort (paired-end sequencing). Maximum coverage varied between 30× and 50× depending on the data. Draft genomes are displayed in the outer cycle and the tree itself. Note that coverage discrepancies observed (e.g., for Burlholderia Mer-3A in the mercury enrichment #1) do not necessarily reflect a binning problem, as metagenomic reads that would have mapped to other genetic structures have a restrained target choice of 8 draft genomes in this analysis.
Figure 6
Figure 6
Panel (A) functional networks linking genomes and their associated functions recovered from ethanol, heavy metals and mercury ESCs. Panel (B) functional network linking the 17 recovered genomes and their associated functions (a total of 11,299 different functions were detected). Networks were generated using Gephi and Force Atlas 2. Node sizes are positively correlated to the number of connections in each network, leading to enhanced sizes for genomes. Note that genome sizes cannot be directly compared between networks. Genomic and functional nodes are colored by taxonomy and their genomic connections, respectively.
Figure 7
Figure 7
Panel (A) functional network linking 11 Rhodanobacter genomes and their functionality (a total of 4,824 functions) using Gephi. Culture-derived genomes are represented by red nodes: 1, R. spathiphylli B39; 2, R. fulvus Jip2; 3, R. sp. 115; 4, R. denitrificans 116- 2; 5, R. thiooxydans LCS2; 6, R. sp. 2APBS1. Metagenomic-derived genomes are represented by purple nodes: 7, R. Metals-1; 8, R. Metals-2; 9, R. Mer-1A; 10, R. Mer-1B; 11, R. Mer-2. Genomic node sizes are positively correlated to the number of connected functions. For the functional nodes, red and purple nodes represent functions detected only in one or more culture-derived or metagenomic-derived genome, respectively. Finally, blue functional nodes are detected in the 11 genomes. Panel (B) functional network linking 27 Streptomyces genomes and their functionality (a total of 11,032 functions) using Gephi. Culture-derived genomes are represented by red nodes: 1, S. griseus NBRC 13350; 2, S. fulvissimus DSM 40593; 3, S. sp. Sirex AA- E; 4, S. sp. PAM C26508; 5, S. flavogriseus ATCC 33331; 6, S. sp. GBA 94- 10; 7, S. sp. PVA 94- 07; 8, S. albus J1074; 9, S. sp. Tu6071; 10, S. venezuelae ATCC 10712; 11, S. cattleya DSM 46488; 12, S. clavuligerus ATCC 27064; 13, S. violaceusniger Tu 4113: 14, S. rapamycinicus NRRL 5491; 15, S. bingchenggensis BCW- 1; 16, S. ghanaensis ATCC 14672; 17, S. albulus CCRC 11814; 18, S. collinus Tu 365; 19, S. davawensis JCM 4913; 20, S. hygroscopicus 5008; 21, S. lividans 1326; 22, S. coelicolor A3(2); 23, S. scabiei 87.22; 24, S. avermitilis MA- 4680. Metagenomic-derived genomes are represented by purple nodes: 25, S. Mer- 1A; 26, S. Mer- 2A; 27, S. Mer- 2B. Genomic node sizes are positively correlated to the number of connected functions. For the functional nodes, blues nodes are detected in all genomes and yellow and green nodes are detected in one and two genomes, respectively.
Figure 8
Figure 8
Panels (A,B) represent the relative abundance and proportion of genomes and orphan genetic structures recovered from our ESCs in various soil biomes generated from Fierer et al. (2012), using a 97% and 90% sequence identity cut-off. Genomes are colored based on their taxonomical affiliation at the genus level. Panel (C) represents the classification of the same samples using our assemblies (genomes and orphan genetic structures) as a reference database and a 90% sequence identity cut-off for mapping. The dendrogram was generated using Ward's method with Euclidean distances.

References

    1. Albertsen M., Hugenholtz P., Skarshewski A., Nielsen K. L., Tyson G. W., Nielsen P. H. (2013). Genome sequences of rare, uncultured bacteria obtained by differential coverage binning of multiple metagenomes. Nat. Biotechnol. 31, 533–538. 10.1038/nbt.2579 - DOI - PubMed
    1. Anantharaman K., Breier J. A., Sheik C. S., Dick G. J. (2013). Evidence for hydrogen oxidation and metabolic plasticity in widespread deep-sea sulfur-oxidizing bacteria. Proc. Natl. Acad. Sci. U.S.A. 110, 330–335. 10.1073/pnas.1215340110 - DOI - PMC - PubMed
    1. Andersson D. I., Hughes D. (2010). Antibiotic resistance and its cost: is it possible to reverse resistance? Nat. Rev. Microbiol. 8, 260–271. 10.1038/nrmicro2319 - DOI - PubMed
    1. Aziz R. K., Bartels D., Best A. A., DeJongh M., Disz T., Edwards R. A., et al. . (2008). The RAST Server: rapid annotations using subsystems technology. BMC genomics 9:75. 10.1186/1471-2164-9-75 - DOI - PMC - PubMed
    1. Barrineau P., Gilbert P., Jackson W., Jones C., Summers A., Wisdom S. (1983). The DNA sequence of the mercury resistance operon of the IncFII plasmid NR1. J. Mol. Appl. Genet. 2, 601–619. - PubMed