. 2014 Oct 23:1:140042.
doi: 10.1038/sdata.2014.42. eCollection 2014.

A comprehensive database of the geographic spread of past human Ebola outbreaks

Affiliations

A comprehensive database of the geographic spread of past human Ebola outbreaks

Adrian Mylne et al. Sci Data. .

Abstract

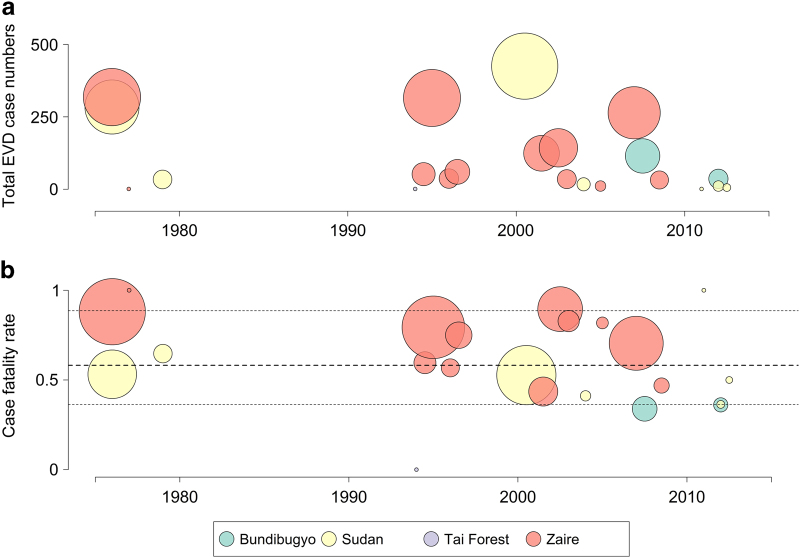
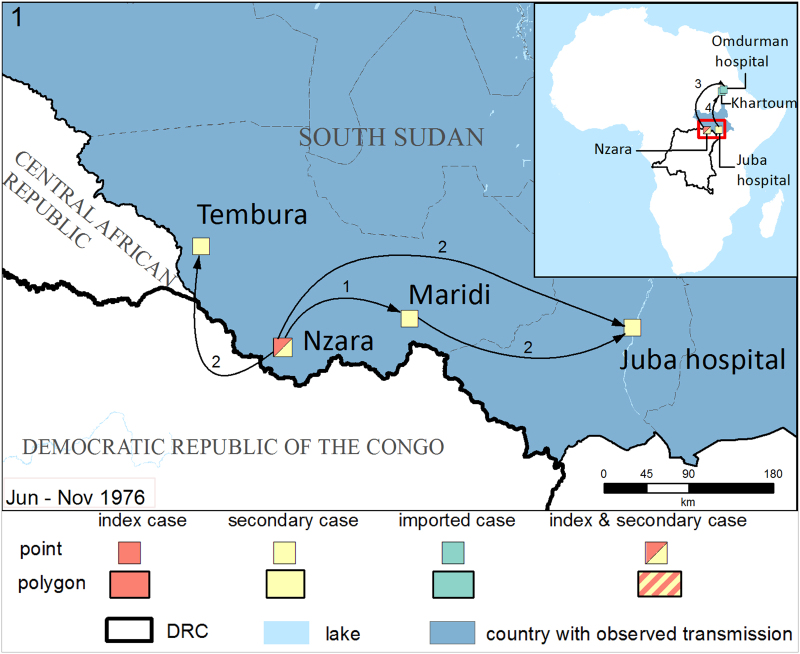
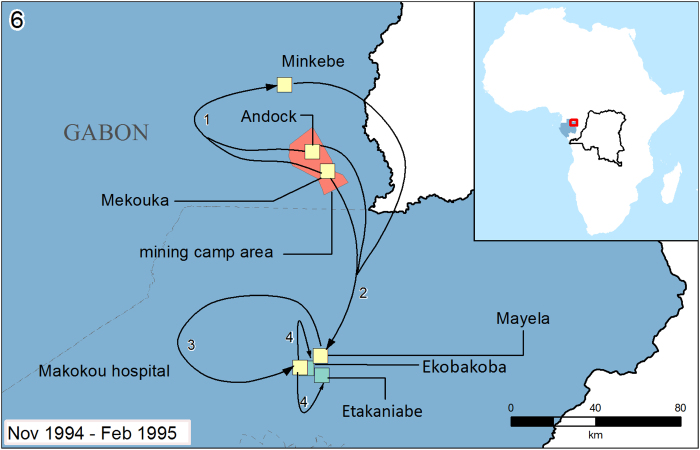
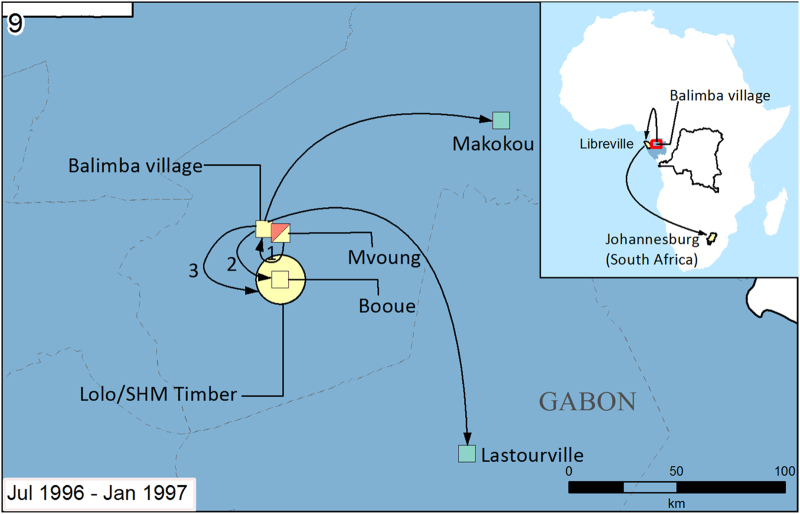
Ebola is a zoonotic filovirus that has the potential to cause outbreaks of variable magnitude in human populations. This database collates our existing knowledge of all known human outbreaks of Ebola for the first time by extracting details of their suspected zoonotic origin and subsequent human-to-human spread from a range of published and non-published sources. In total, 22 unique Ebola outbreaks were identified, composed of 117 unique geographic transmission clusters. Details of the index case and geographic spread of secondary and imported cases were recorded as well as summaries of patient numbers and case fatality rates. A brief text summary describing suspected routes and means of spread for each outbreak was also included. While we cannot yet include the ongoing Guinea and DRC outbreaks until they are over, these data and compiled maps can be used to gain an improved understanding of the initial spread of past Ebola outbreaks and help evaluate surveillance and control guidelines for limiting the spread of future epidemics.


Conflict of interest statement

The authors declare no competing financial interests.

Figures

Figure 1
Figure 1. The size (a) and case fatality rate (b) of the 22 previous Ebola outbreaks (suspected and confirmed cases).
Circle area is proportional to the total number of reported cases (a) or deaths (b) for each outbreak. Circle colour represents different species of Ebolavirus. Black dotted lines in (b) show the median and upper and lower 75% quantiles of outbreak case fatality rate.
Figure 2
Figure 2. Map of the South Sudan (1976) outbreak.
The first reported cases of Sudan Ebola virus were in three workers at a cotton factory in Nzara, in close proximity to three game reserves. The method of acquisition was unknown. The first secondary cases arose in Nzara infecting a total of 67 people who were primarily family members of the factory workers. Further secondary transmission clusters emerged in Maridi following spread from Nzara due to seeking treatment, after which further cases occurred in Juba due to patients who were referred. Additional cases from Maridi were also referred directly to Juba making the source of infection in Juba difficult to identify. Secondary transmission also emerged in Tembura due to a patient seeking family care, although the source of this infection is unknown. Imported cases from Juba to Khartoum and from Nzara to Omdurman were also reported following a patient seeking treatment and a referral for diagnosis respectively (see inset). The principal mode of transmission in this outbreak was initially familial, although in Maridi secondary transmission arose through nosocomial transmission. Seeking of treatment was the principal cause of geographic spread. The first index case became ill on the 27 June 1976 before the first secondary cases in July and subsequent secondary transmission clusters from August to October. Cases peaked in September (138 cases, 65 deaths). The final case was reported on 25 November 1976. Imported cases in Omdurman and Khartoum were reported in August and September, respectively. Overall, 284 cases were reported with 151 deaths giving a CFR of 53.2%. This figure varied in different locations: Nzara (67,31,46%), Maridi (213,116,55%), Tembura (3,3,100%), Juba (1,1,100%). Arrows indicate order of spread. Where spread order is known, numbers are indicative of the order of spread. Arrows sharing the same number indicate that it was not possible to distinguish which spread happened first.
Figure 3
Figure 3. Map of the Gabon (1994) outbreak.
The first reported cases of Zaire Ebola virus were in miners from the Mekouka and Andock encampments, suspected to have contracted the infection in the surrounding area. The method of acquisition was unknown. The first secondary cases arose within these two encampments and then spread to the Minkebe camp. Further secondary transmission clusters emerged in Mayela then Makokou general hospital after 32 patients from the forest encampments sought treatment. Cases were also reported in Ekataniabe and Ekobakoba who had recent travel histories to Makokou general hospital. The principal modes of transmission were among workers at first, followed by nosocomial in Makokou general hospital and familial in Mayela (connected by a single traditional healer). The initial case was reported on 13 November 1994 before secondary transmission clusters occurred from the end of January to February 1995. Cases and deaths peaked in December (26 cases, 14 deaths (53.8% CFR)). The final case was reported on 9 February 1995 in Ekobakoba. Overall, 49 cases were reported with 30 deaths, giving a CFR of 61.2%. For map key, see Fig. 2.
Figure 4
Figure 4. Map of the Gabon (1996b) outbreak.
The index case of Zaire Ebola virus likely came from one of three infected hunters in a logging camp near Mvoung. The timing of infection makes it difficult to distinguish index cases from secondary cases during the early stages of this outbreak, but it is likely that the first secondary cases emerged amongst the hunters who then sought treatment from a traditional healer in Balimba. After falling ill, the traditional healer from Balimba sought treatment in Booue, where the disease then radially spread through the communities in the surrounding areas. A further secondary transmission cluster emerged in Libreville (see inset) after patients from Balimba sought treatment there. In Libreville one doctor became infected and flew to Johannesburg, South Africa for treatment before receiving a diagnosis of Ebola. Limited further nosocomial transmission (1 case) occurred upon his arrival in Johannesburg. Imported cases in Makokou General Hospital and Lastourville were also reported after patients from Balimba sought treatment. No clear principal mode of transmission was observed for the early stages of the outbreak, but in Libreville secondary transmission mainly arose through nosocomial transmission. The index case was reported on the 13 July 1976 before the first secondary cases in September and subsequent secondary transmission clusters from September to January. Cases peaked in September and deaths peaked in October. The final case was reported on 18 January 1997. Overall 60 cases were reported with 45 deaths, giving a CFR of 75%. For map key, see Fig. 2.

References

Data Citations

    1. Mylne A. 2014. Figshare. http://dx.doi.org/10.6084/m9.figshare.1168886 - DOI

References

    1. Barrette R. W. et al. Discovery of swine as a host for the Reston ebolavirus. Science 325, 204–206 (2009). - PubMed
    1. Feldmann H. & Geisbert T. W. Ebola haemorrhagic fever. The Lancet 377, 849–862 (2011). - PMC - PubMed
    1. Le Guenno B. et al. Isolation and partial characterisation of a new strain of Ebola virus. The Lancet 345, 1271–1274 (1995). - PubMed
    1. King A. M., Adams M. J., Lefkowitz E. J. & Carstens E. B. Virus Taxonomy: Classification and Nomenclature of Viruses: Ninth Report of the International Committee on Taxonomy of Viruses Vol. 9. (Elsevier, 2012).
    1. Kuhn J. & Calisher C. H. Filoviruses: A Compendium of 40 Years of Epidemiological, Clinical, and Laboratory Studies 1st edn, Vol. 20 (Springer, 2008). - PubMed

Publication types