. 2015 Jul;12(7):623-30.
doi: 10.1038/nmeth.3407. Epub 2015 May 18.

Combining tumor genome simulation with crowdsourcing to benchmark somatic single-nucleotide-variant detection

Collaborators, Affiliations

Combining tumor genome simulation with crowdsourcing to benchmark somatic single-nucleotide-variant detection

Adam D Ewing et al. Nat Methods. 2015 Jul.

Abstract

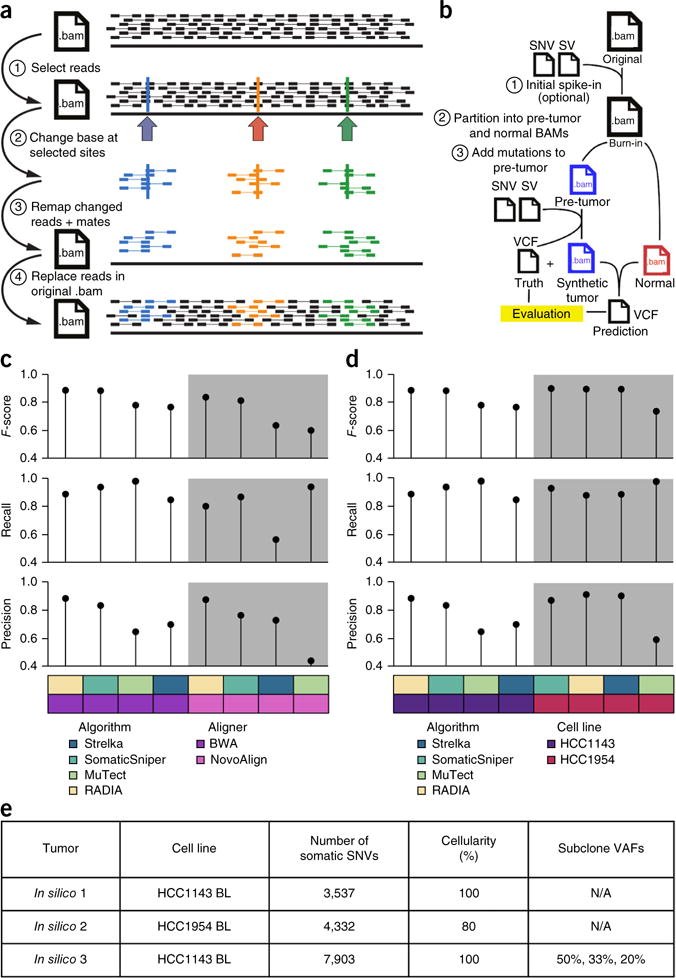
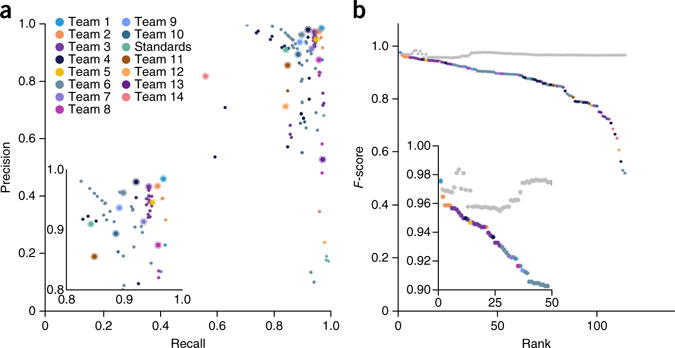
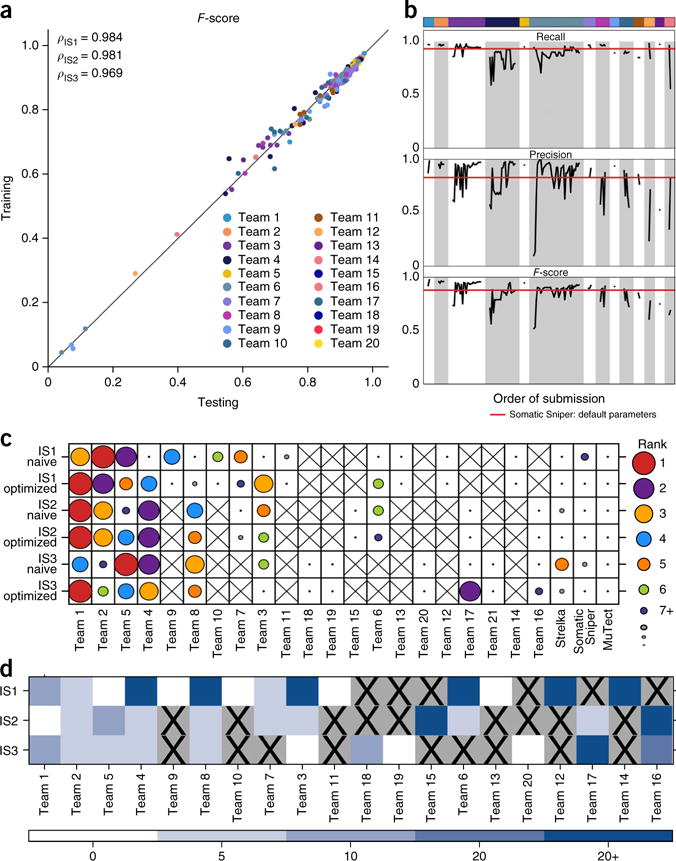
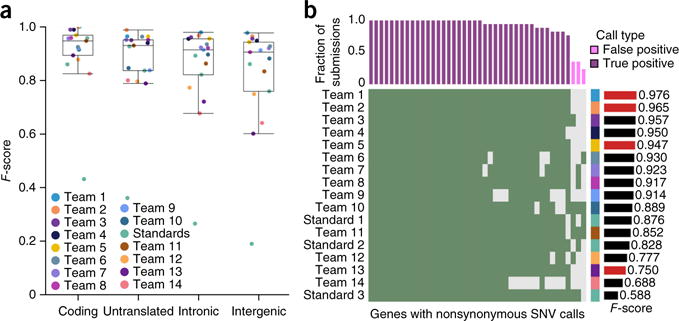
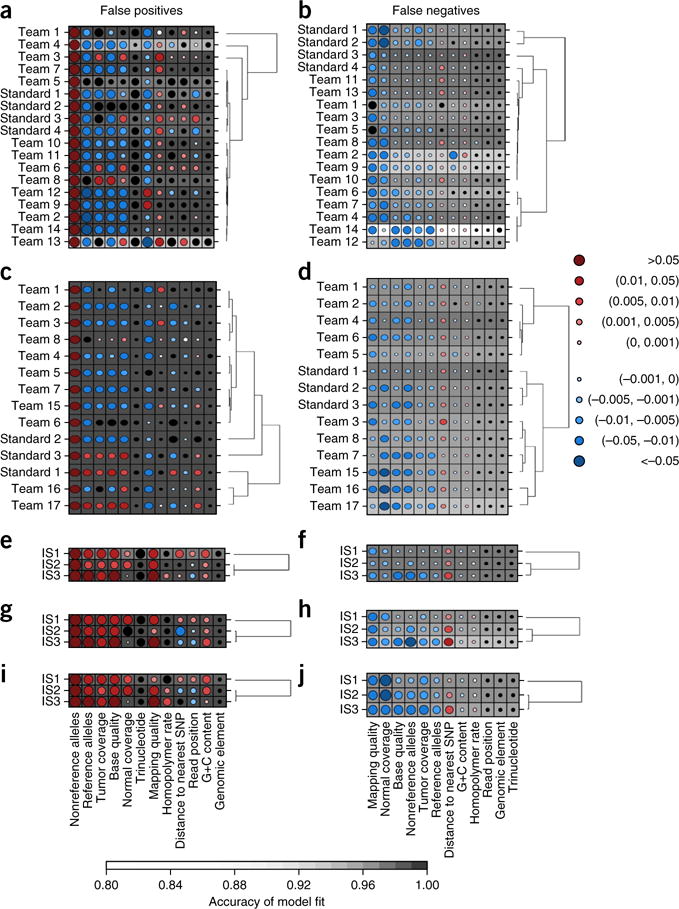
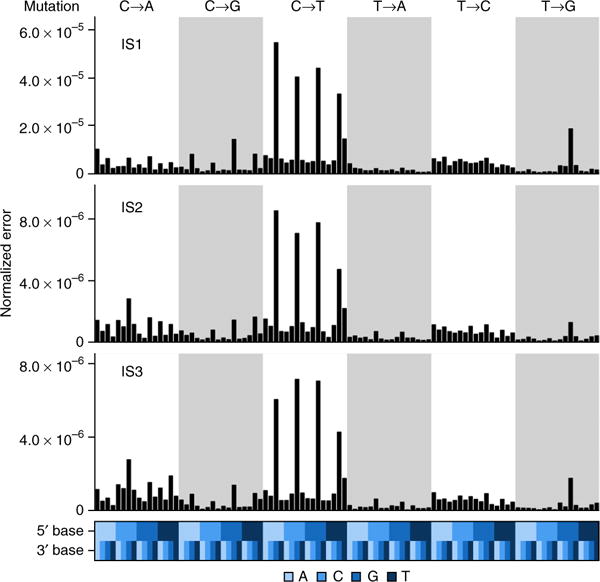
The detection of somatic mutations from cancer genome sequences is key to understanding the genetic basis of disease progression, patient survival and response to therapy. Benchmarking is needed for tool assessment and improvement but is complicated by a lack of gold standards, by extensive resource requirements and by difficulties in sharing personal genomic information. To resolve these issues, we launched the ICGC-TCGA DREAM Somatic Mutation Calling Challenge, a crowdsourced benchmark of somatic mutation detection algorithms. Here we report the BAMSurgeon tool for simulating cancer genomes and the results of 248 analyses of three in silico tumors created with it. Different algorithms exhibit characteristic error profiles, and, intriguingly, false positives show a trinucleotide profile very similar to one found in human tumors. Although the three simulated tumors differ in sequence contamination (deviation from normal cell sequence) and in subclonality, an ensemble of pipelines outperforms the best individual pipeline in all cases. BAMSurgeon is available at https://github.com/adamewing/bamsurgeon/.


Conflict of interest statement

COMPETING FINANCIAL INTERESTS

The authors declare no competing financial interests.

Figures

Figure 1
Figure 1
BAMSurgeon simulates tumor genome sequences. (a) Overview of SNV spike-in. (1) A list of positions is selected in a BAM alignment. (2) The desired base change is made at a user-specified variant allele fraction (VAF) in reads overlapping the chosen positions. (3) Altered reads are remapped to the reference genome. (4) Realigned reads replace corresponding unmodified reads in the original BAM. (b) Overview of workflow for creating synthetic tumor-normal pairs. Starting with a high-depth mate-pair BAM alignment, SNVs and structural variants (SVs) are spiked in to yield a ‘burn-in’ BAM. Paired reads from this BAM are randomly partitioned into a normal BAM and a pre-tumor BAM that receives spike-ins via BAMSurgeon to yield the synthetic tumor and a ‘truth’ VCF file containing spiked-in positions. Mutation predictions are evaluated against this ground truth. (c,d) To test the robustness of BAMSurgeon with respect to changes in aligner (c) and cell line (d), we compared the rank of RADIA, MuTect, SomaticSniper and Strelka on two new tumor-normal data sets: one with an alternative aligner, NovoAlign, and the other on an alternative cell line, HCC1954. RADIA and SomaticSniper retained the top two positions, whereas MuTect and Strelka remained third and fourth, independently of aligner and cell line. (e) Summary of the three in silico tumors described here.
Figure 2
Figure 2
Overview of the SMC-DNA Challenge data set. (a) Precision-recall plot for all IS1 entries. Colors represent individual teams, and the best submission (top F-score) from each team is circled. The inset highlights top-ranking submissions. (b) Performance of an ensemble somatic SNV predictor. The ensemble was generated by taking the majority vote of calls made by a subset of the top-performing IS1 submissions. At each rank k, the gray dot indicates performance of the ensemble algorithms ranking 1 to k, and the colored dot indicates the performance of the algorithm at that rank.
Figure 3
Figure 3
Effects of algorithm tuning. (a) The performance of groups on the training data set and on the held-out portion of the genome (~10%) are tightly correlated (Spearman’s ρ = 0.98) and fall near the plotted y = x line for all three tumors. (b) F-score, precision and recall of all submissions made by each team on IS1 are plotted in the order they were submitted. Teams were ranked by the F-score of their best submissions. Color coding as in a. The horizontal red lines give the F-score, precision and recall of the best-scoring algorithm submitted by the Challenge administrators, SomaticSniper. A clear improvement in recall, precision and F-score can be seen as participants adjusted parameters over the course of the challenge. Bar width corresponds to the number of submissions made by each team. (c) For each tumor, each team’s initial (“naive”) and final (“optimized”) submissions are shown, with dot size and color indicating overall ranking within these two groups. An “X” indicates that a team did not submit to a specific tumor (or changed the team name). Algorithm rankings were moderately changed by parameterization. (d) For each tumor, we assessed how much each team was able to improve its performance. The color scale represents bins of F-score improvement.
Figure 4
Figure 4
Effects of genomic localization. (a) Box plots show the median (line), interquartile range (IQR; box) and ±1.5× IQR (whiskers). For IS1, F-scores were highest in coding and untranslated regions and lowest in introns and intergenic (P = 6.61 × 10⁻⁷; Friedman rank-sum test). (b) Rows show individual submissions to IS1; columns show genes with nonsynonymous SNV calls. Green shading means a call was made. The upper bar plot indicates the fraction of submissions agreeing on these calls, and the color indicates whether these are FPs or TPs. The bar plot on the right gives the F-score of the submission over the whole genome. The right-hand side covariate shows the submitting team. All TPs are shown, along with a subset of FPs.
Figure 5
Figure 5
Characteristics of prediction errors. (aj) Random Forests assess the importance of 12 genomic variables on SNV prediction accuracy (Online Methods). Random Forest analysis of FPs (a,c,e,g,i) and FNs (b,d,f,h,j) for IS1 (a,b) and IS2 (c,d) as well as for all three tumors using default settings with widely used algorithms MuTect (e,f), SomaticSniper (g,h) and Strelka (i,j). Dot size reflects mean change in accuracy caused by removing this variable from the model. Color reflects the directional effect of each variable (red for increasing metric values associated with increased error; blue for decreasing values associated with increased error; black for factors). Background shading indicates the accuracy of the model fit (see bar at bottom for scale). Each row represents a single set of predictions for a given in silico tumor, and each column shows a genomic variable. SNP, single-nucleotide polymorphism.
Figure 6
Figure 6
Trinucleotide error profiles. Proportions of FP SNVs are normalized to the number observed in the entire genome (top) binned by trinucleotide context (bottom) for IS1–IS3.

References

    1. Lawrence MS, et al. Discovery and saturation analysis of cancer genes across 21 tumour types. Nature. 2014;505:495–501. - PMC - PubMed
    1. Ciriello G, et al. Emerging landscape of oncogenic signatures across human cancers. Nat Genet. 2013;45:1127–1133. - PMC - PubMed
    1. The Cancer Genome Atlas Research Network. Integrated genomic characterization of endometrial carcinoma. Nature. 2013;497:67–73. - PMC - PubMed
    1. Anonymous. Adaptive BATTLE trial uses biomarkers to guide lung cancer treatment. Nat Rev Drug Discov. 2010;9:423. - PubMed
    1. Tran B, et al. Feasibility of real time next generation sequencing of cancer genes linked to drug response: results from a clinical trial. Int J Cancer. 2013;132:1547–1555. - PubMed

Publication types

Associated data