Ratios of Four STAT3 Splice Variants in Human Eosinophils and Diffuse Large B Cell Lymphoma Cells
- PMID: 25984943
- PMCID: PMC4436176
- DOI: 10.1371/journal.pone.0127243
Ratios of Four STAT3 Splice Variants in Human Eosinophils and Diffuse Large B Cell Lymphoma Cells
Abstract
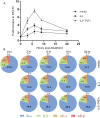
Signal transducer and activator of transcription 3 (STAT3) is a key mediator of leukocyte differentiation and proliferation. The 3' end of STAT3 transcripts is subject to two alternative splicing events. One results in either full-length STAT3α or in STAT3β, which lacks part of the C-terminal transactivation domain. The other is at a tandem donor (5') splice site and results in the codon for Ser-701 being included (S) or excluded (ΔS). Despite the proximity of Ser-701 to the site of activating phosphorylation at Tyr-705, ΔS/S splicing has barely been studied. Sequencing of cDNA from purified eosinophils revealed the presence of four transcripts (S-α, ΔS-α, S-β, and ΔS-β) rather than the three reported in publically available databases from which ΔS-β is missing. To gain insight into regulation of the two alternative splicing events, we developed a quantitative(q) PCR protocol to compare transcript ratios in eosinophils in which STAT3 is upregulated by cytokines, activated B cell diffuse large B cell Lymphoma (DLBCL) cells in which STAT3 is dysregulated, and in germinal center B cell-like DLBCL cells in which it is not. With the exception of one line of activated B cell DLCBL cells, the four variants were found in roughly the same ratios despite differences in total levels of STAT3 transcripts. S-α was the most abundant, followed by S-β. ΔS-α and ΔS-β together comprised 15.6 ± 4.0 % (mean ± SD, n = 21) of the total. The percentage of STAT3β variants that were ΔS was 1.5-fold greater than of STAT3α variants that were ΔS. Inspection of Illumina's "BodyMap" RNA-Seq database revealed that the ΔS variant accounts for 10-26 % of STAT3 transcripts across 16 human tissues, with less variation than three other genes with the identical tandem donor splice site sequence. Thus, it seems likely that all cells contain the S-α, ΔS-α, S-β, and ΔS-β variants of STAT3.
Conflict of interest statement
Figures


Similar articles
-
Merging Absolute and Relative Quantitative PCR Data to Quantify STAT3 Splice Variant Transcripts.J Vis Exp. 2016 Oct 9;(116):54473. doi: 10.3791/54473. J Vis Exp. 2016. PMID: 27768061 Free PMC article.
-
A mix of S and ΔS variants of STAT3 enable survival of activated B-cell-like diffuse large B-cell lymphoma cells in culture.Oncogenesis. 2016 Jan 4;4(1):e184. doi: 10.1038/oncsis.2015.44. Oncogenesis. 2016. PMID: 26727576 Free PMC article.
-
A novel missense (M206K) STAT3 mutation in diffuse large B cell lymphoma deregulates STAT3 signaling.PLoS One. 2013 Jul 4;8(7):e67851. doi: 10.1371/journal.pone.0067851. Print 2013. PLoS One. 2013. PMID: 23861822 Free PMC article.
-
Regulation of the MIR155 host gene in physiological and pathological processes.Gene. 2013 Dec 10;532(1):1-12. doi: 10.1016/j.gene.2012.12.009. Epub 2012 Dec 14. Gene. 2013. PMID: 23246696 Review.
-
STAT3beta, a distinct isoform from STAT3.Int J Biochem Cell Biol. 2019 May;110:130-139. doi: 10.1016/j.biocel.2019.02.006. Epub 2019 Feb 26. Int J Biochem Cell Biol. 2019. PMID: 30822557 Review.
Cited by
-
Survival associated alternative splicing events in diffuse large B-cell lymphoma.Am J Transl Res. 2018 Aug 15;10(8):2636-2647. eCollection 2018. Am J Transl Res. 2018. PMID: 30210700 Free PMC article.
-
Expression of novel "LOCGEF" isoforms of ARHGEF18 in eosinophils.J Leukoc Biol. 2018 Jul;104(1):135-145. doi: 10.1002/JLB.2MA1017-418RR. Epub 2018 Mar 30. J Leukoc Biol. 2018. PMID: 29601110 Free PMC article.
-
Splicing analysis of STAT3 tandem donor suggests non-canonical binding registers for U1 and U6 snRNAs.Nucleic Acids Res. 2024 Jun 10;52(10):5959-5974. doi: 10.1093/nar/gkae147. Nucleic Acids Res. 2024. PMID: 38426935 Free PMC article.
-
STAT3 Activation and Oncogenesis in Lymphoma.Cancers (Basel). 2019 Dec 19;12(1):19. doi: 10.3390/cancers12010019. Cancers (Basel). 2019. PMID: 31861597 Free PMC article. Review.
-
Proteomics of Eosinophil Activation.Front Med (Lausanne). 2017 Sep 29;4:159. doi: 10.3389/fmed.2017.00159. eCollection 2017. Front Med (Lausanne). 2017. PMID: 29034237 Free PMC article. Review.
References
-
- Akira S. Roles of STAT3 defined by tissue-specific gene targeting. Oncogene. 2000;19: 2607–2611. - PubMed
-
- Maritano D, Sugrue ML, Tininini S, Dewilde S, Strobl B, Fu X, et al. The STAT3 isoforms alpha and beta have unique and specific functions. Nat Immunol. 2004;5: 401–409. - PubMed
-
- Stahl N, Farruggella TJ, Boulton TG, Zhong Z, Darnell JE Jr., Yancopoulos GD. Choice of STATs and other substrates specified by modular tyrosine-based motifs in cytokine receptors. Science. 1995;267: 1349–1353. - PubMed
Publication types
MeSH terms
Substances
Grants and funding
LinkOut - more resources
Full Text Sources
Other Literature Sources
Molecular Biology Databases
Miscellaneous

