. 2015 May 18;10(5):e0126892.
doi: 10.1371/journal.pone.0126892. eCollection 2015.

An early diagnostic tool for diabetic peripheral neuropathy in rats

Affiliations

An early diagnostic tool for diabetic peripheral neuropathy in rats

Shoista Kambiz et al. PLoS One. .

Erratum in

Abstract

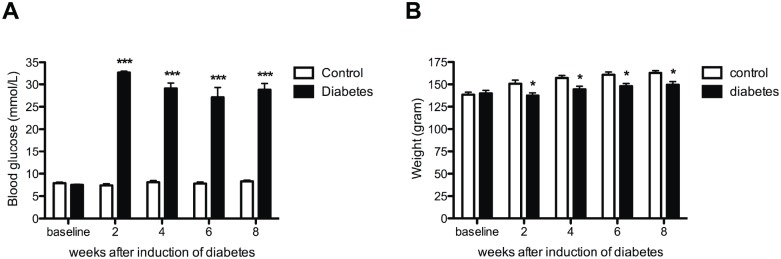
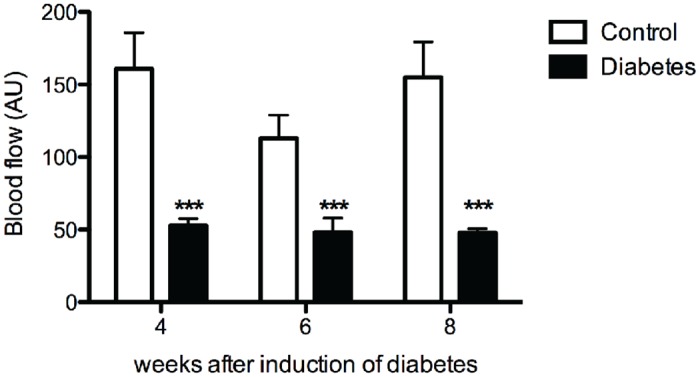
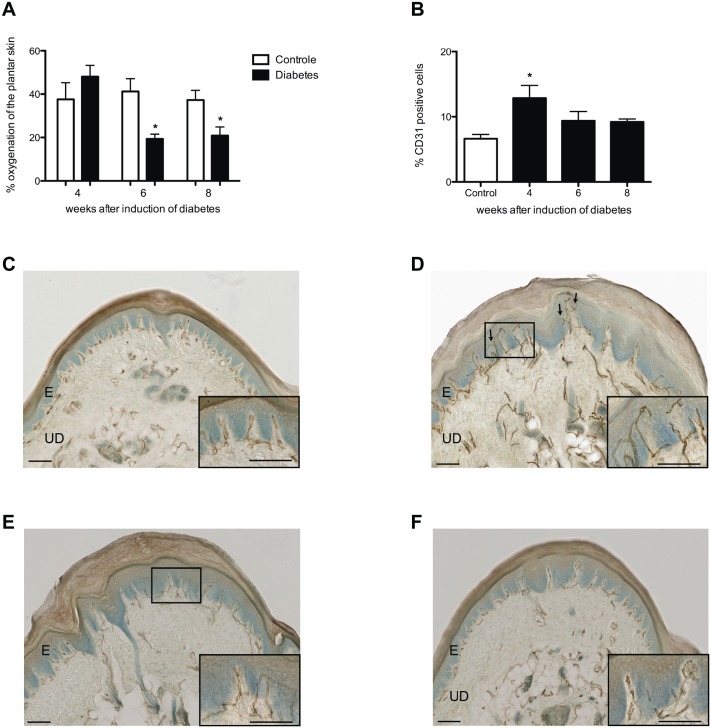
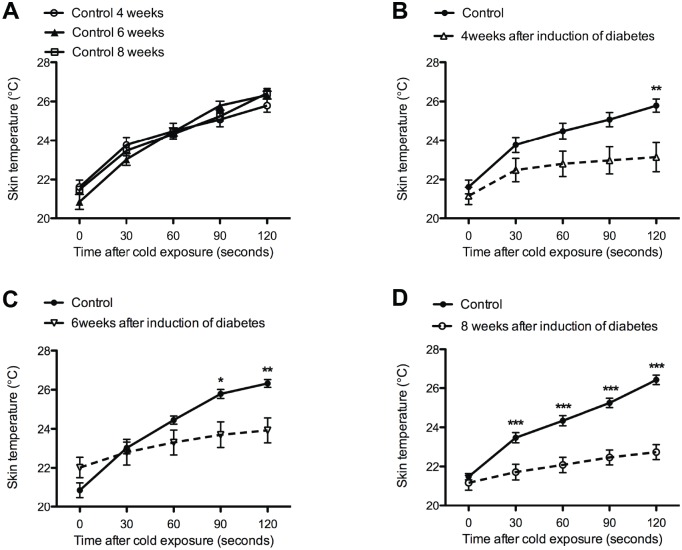
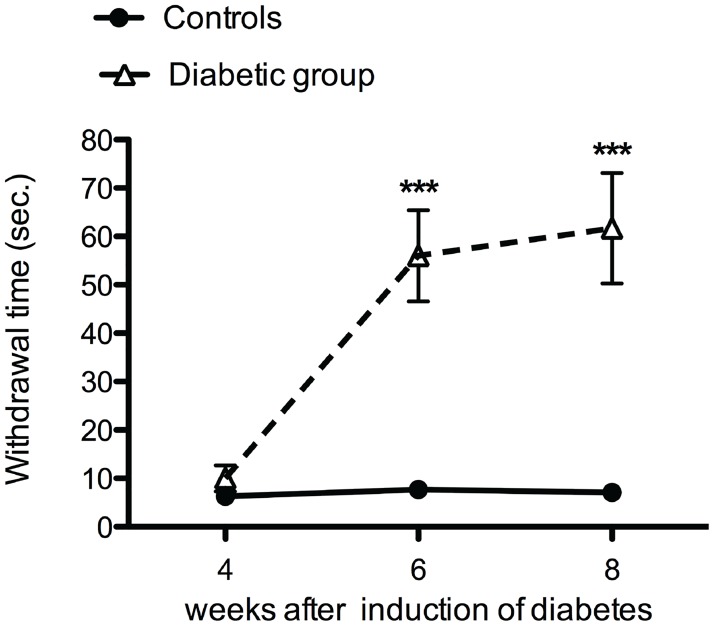
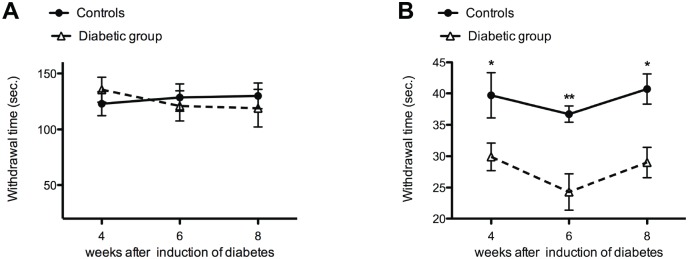
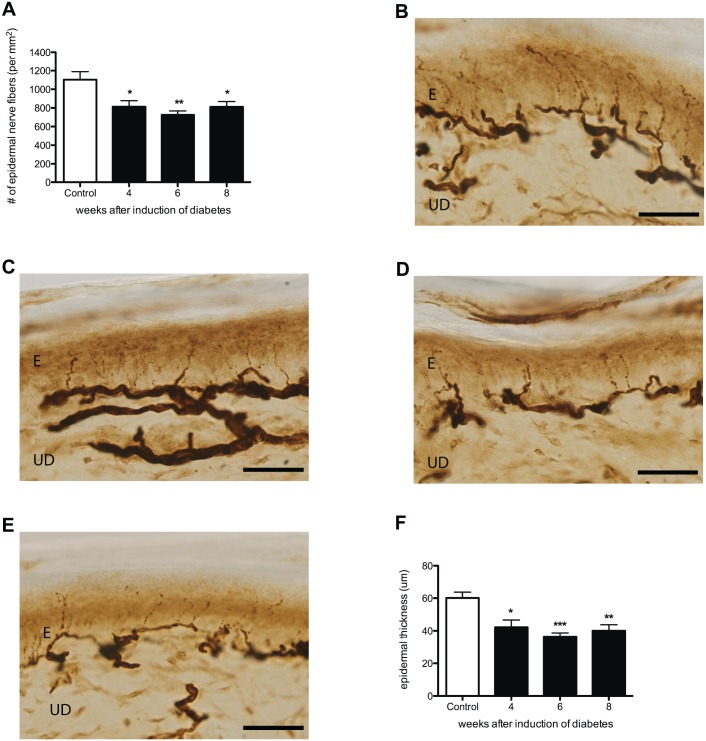
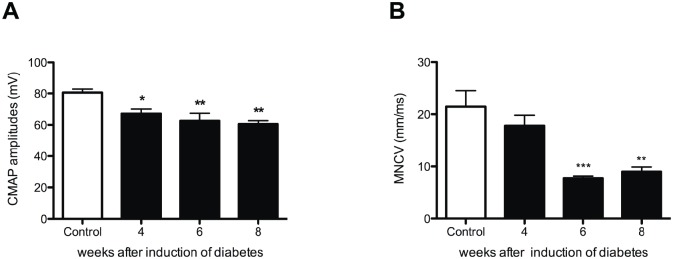
The skin's rewarming rate of diabetic patients is used as a diagnostic tool for early diagnosis of diabetic neuropathy. At present, the relationship between microvascular changes in the skin and diabetic neuropathy is unclear in streptozotocin (STZ) diabetic rats. The aim of this study was to investigate whether the skin rewarming rate in diabetic rats is related to microvascular changes and whether this is accompanied by changes observed in classical diagnostic methods for diabetic peripheral neuropathy. Computer-assisted infrared thermography was used to assess the rewarming rate after cold exposure on the plantar skin of STZ diabetic rats' hind paws. Peripheral neuropathy was determined by the density of intra-epidermal nerve fibers (IENFs), mechanical sensitivity, and electrophysiological recordings. Data were obtained in diabetic rats at four, six, and eight weeks after the induction of diabetes and in controls. Four weeks after the induction of diabetes, a delayed rewarming rate, decreased skin blood flow and decreased density of IENFs were observed. However, the mechanical hyposensitivity and decreased motor nerve conduction velocity (MNCV) developed 6 and 8 weeks after the induction of diabetes. Our study shows that the skin rewarming rate is related to microvascular changes in diabetic rats. Moreover, the skin rewarming rate is a non-invasive method that provides more information for an earlier diagnosis of peripheral neuropathy than the classical monofilament test and MNCV in STZ induced diabetic rats.


Conflict of interest statement

Competing Interests: The authors have declared that no competing interests exist.

Figures

Fig 1
Fig 1. Increased blood glucose and stable body weight in diabetic animals.
Blood glucose was increased in all diabetic animals (black bars) when compared to controls (white bars) (A). Significantly smaller increase in body weight is demonstrated in the diabetic animals (black bars) when compared to controls (white bars) (B). Data are presented as mean ± SEM. *p <0.05, ***p <0.001 (One-way ANOVA with Tukey post hoc test).
Fig 2
Fig 2. Degeneration of pancreatic tissue in diabetic animals.
Hematoxylin and eosin stained Fig.s of the pancreas (A, B) showing that the cells and the Islets of Langerhans were considerably smaller in the diabetic pancreas (B) compared to control (A). Scale bar 100um.
Fig 3
Fig 3. Decreased skin blood flow in diabetic animals.
Plantar skin blood flow was decreased in all diabetic animals (black bars) when compared to controls (white bars). Data is presented as mean ± SEM. *** p< 0.001 (two-way ANOVA with one repeated-measures factor ‘time’ with Bonferroni post-test).
Fig 4
Fig 4. Percentage skin oxygenation and CD31-positive cells in the plantar skin.
Decreased percentage in skin oxygenation was observed in diabetic animals (black bars) 6 and 8 weeks after the induction of diabetes when compared to controls (white bars) (A). Four weeks after induction of diabetes (black bar) a significantly increased percentage CD31-positive cells was observed in diabetic rats when compared to controls (white bar) (B), which is illustrated in histological scans of controls (C), 4 (D), 6 (E), and 8 (F) weeks after the induction of diabetes. Arrows indicate sprouting angiogenesis. Scale bars 50um.
Fig 5
Fig 5. Decreased skin temperature of the plantar hind paw after cold exposure.
Control groups were not significantly different (A). Significant lower skin temperatures were observed in diabetic animals 4 (B), 6 (C), and 8 weeks (D) after the induction of diabetes (dotted line) when compared to controls (continuous line). Data is presented as mean ± SEM. *p < 0.05, **p <0.01, *** p< 0.001 (two-way ANOVA with one repeated-measures factor ‘time’ with Bonferroni post-test).
Fig 6
Fig 6. Diabetic animals developed mechanical hyposensitivity.
Increased mechanical withdrawal threshold was observed 6 and 8 weeks after induction of diabetes (dotted line) when compared to control (continuous line) Data is presented as mean ± SEM. *** p< 0.001 (two-way ANOVA with one repeated-measures factor ‘time’ with Bonferroni post-test).
Fig 7
Fig 7. Heat hypersensitivity in diabetic animals.
No significant difference was observed between the diabetic animals (dotted line) and controls (continuous line) for the cold plate test (5°C) (A). In contrast to the cold plate test, decreased withdrawal time was observed for the hot plate test (50°C) in diabetic animals (dotted line) when compared to control (continuous line) at all experimental time points (B).
Fig 8
Fig 8. Decreased innervation and decreased epidermal thickness in STZ diabetic rats.
Decreased density PGP9.5-IR nerve fibers (A) and average epidermal thickness (F) was demonstrated in the plantar skin of diabetic animals 4, 6, and 8 weeks after induction of diabetes (black bars) when compared to control (white bar). This is illustrated by histological sections of plantar skin in controls (B), and 4 (C), 6 (D), and 8 (E) weeks after induction of diabetes. Data is presented as mean ± SEM. *p < 0.05, **p <0.01 (One-way ANOVA with Tukey post hoc test). E = epidermis, UD = upper dermis, scale bar = 100um.
Fig 9
Fig 9. Electrophysiological changes in diabetic animals.
CMAP amplitude decreased in all diabetic groups (black bars) when compared to controls (white bars) (A), while MNVC showed a significant decrease 6 and 8 weeks after induction of diabetes (B).

Similar articles

Cited by

References

    1. Narayanaswamy H, Facer P, Misra VP, Timmers M, Byttebier G, Meert T, et al. A longitudinal study of sensory biomarkers of progression in patients with diabetic peripheral neuropathy using skin biopsies. J Clin Neurosci. 2012;19(11):1490–6. 10.1016/j.jocn.2011.12.026 - DOI - PubMed
    1. Jin HY, Kang SM, Liu WJ, Song CH, Lee KA, Baek HS, et al. Comparison of peripheral nerve damages according to glucose control timing in experimental diabetes. Exp Clin Endocrinol Diabetes. 2012;120(8):451–9. 10.1055/s-0032-1306350 - DOI - PubMed
    1. Tuncer S, Dalkilic N, Esen HH, Avunduk MC. An early diagnostic tool for diabetic neuropathy: conduction velocity distribution. Muscle Nerve. 2011;43(2):237–44. 10.1002/mus.21837 - DOI - PubMed
    1. Coppey LJ, Davidson EP, Dunlap JA, Lund DD, Yorek MA. Slowing of motor nerve conduction velocity in streptozotocin-induced diabetic rats is preceded by impaired vasodilation in arterioles that overlie the sciatic nerve. Int J Exp Diabetes Res. 2000;1(2):131–43. - PMC - PubMed
    1. Mori T, Nagase T, Takehara K, Oe M, Ohashi Y, Amemiya A, et al. Morphological pattern classification system for plantar thermography of patients with diabetes. J Diabetes Sci Technol. 2013;7(5):1102–12. - PMC - PubMed

Publication types

MeSH terms