. 2015 May 18:5:9850.
doi: 10.1038/srep09850.

Spatial mapping of the biologic effectiveness of scanned particle beams: towards biologically optimized particle therapy

Affiliations

Spatial mapping of the biologic effectiveness of scanned particle beams: towards biologically optimized particle therapy

Fada Guan et al. Sci Rep. .

Abstract

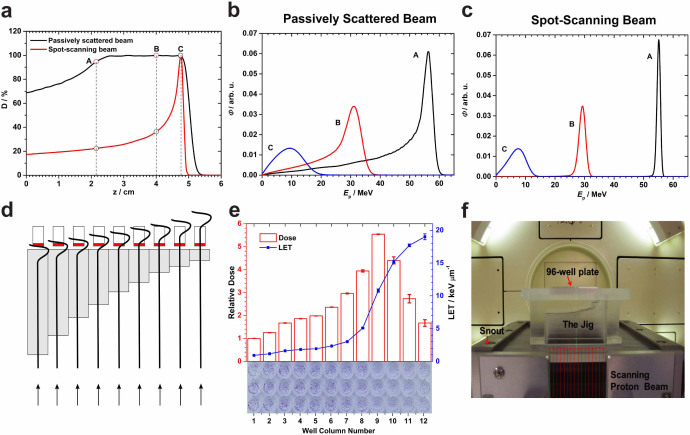
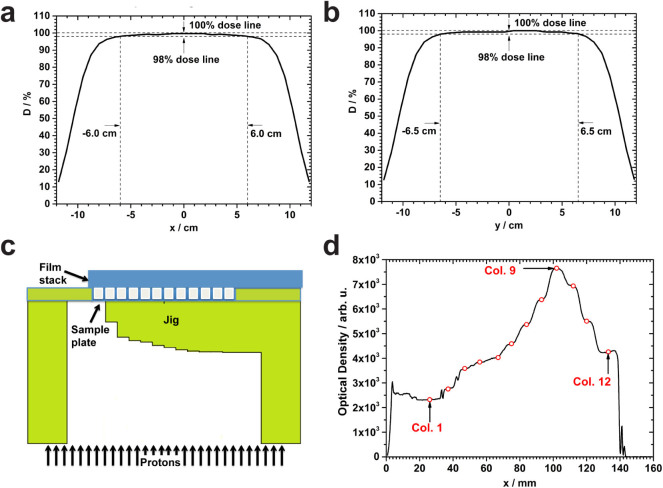
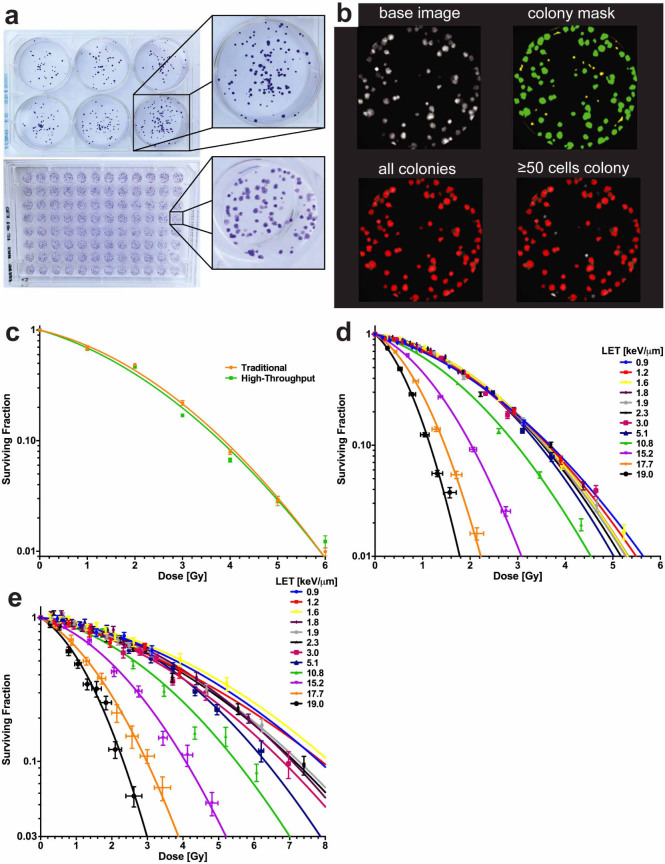
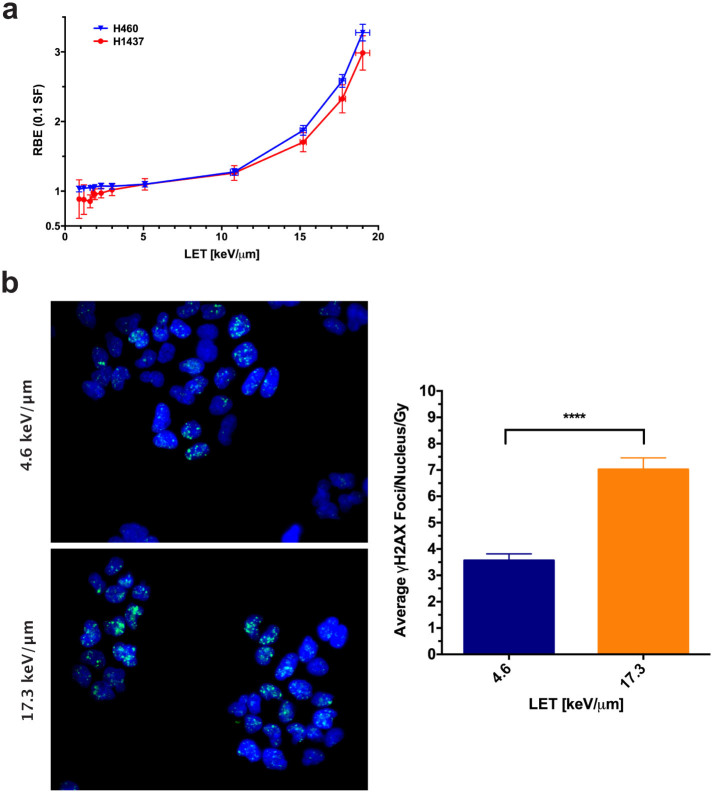
The physical properties of particles used in radiation therapy, such as protons, have been well characterized, and their dose distributions are superior to photon-based treatments. However, proton therapy may also have inherent biologic advantages that have not been capitalized on. Unlike photon beams, the linear energy transfer (LET) and hence biologic effectiveness of particle beams varies along the beam path. Selective placement of areas of high effectiveness could enhance tumor cell kill and simultaneously spare normal tissues. However, previous methods for mapping spatial variations in biologic effectiveness are time-consuming and often yield inconsistent results with large uncertainties. Thus the data needed to accurately model relative biological effectiveness to guide novel treatment planning approaches are limited. We used Monte Carlo modeling and high-content automated clonogenic survival assays to spatially map the biologic effectiveness of scanned proton beams with high accuracy and throughput while minimizing biological uncertainties. We found that the relationship between cell kill, dose, and LET, is complex and non-unique. Measured biologic effects were substantially greater than in most previous reports, and non-linear surviving fraction response was observed even for the highest LET values. Extension of this approach could generate data needed to optimize proton therapy plans incorporating variable RBE.


Figures

Figure 1
Figure 1. Rationale for using the scanned monoenergetic proton beams for biology experiments and design of the irradiation device.
(a) Depth-dose profiles for a 79.7-MeV scanned proton beam vs. a matched passively scattered beam of the same range with a 3-cm spread-out Bragg peak (SOBP) in water. (b) Energy spectra of protons at three points A, B, C within the scattered beam marked in panel (a). (c) Corresponding energy spectra for the monoenergetic 79.7-MeV scanned beam. (d) Schematic diagram of the irradiation device (jig) concept illustrating the strategy for the column-by-column simultaneous irradiation of biological samples in the 96-well plate with protons at different points on the pristine Bragg curve. Gray bars indicate Lucite; red, culture medium. The stepped construction is designed to match the columns of a 96-well plate and serves to vary position along the Bragg curve, although only 9 columns are shown in the illustration and the step dimensions are not to scale. (e) Dose and LET distributions in the cell layers, positioned atop the jig, were computed using Monte Carlo simulations. The relative dose results shown were normalized to the entrance dose in column 1 in the 96-well plate. The LET shown is dose-averaged LET. The associated errors for both dose and LET were obtained from a sensitivity analysis of experimental setup uncertainties. The thickness of the 12 steps in the jig was selected according to the variations of dose and LET along the Bragg curve. Column 9 was aligned with the Bragg peak by inserting three films of thickness 268 µm each. An exposed and processed 96-well plate is shown at the bottom of the panel to illustrate the dose-LET effect of cell kill. (f) The jig directly mounted onto the scanning beam gantry. The 96-well plates are inserted into a precisely milled slot in the jig holder designed to minimize positioning errors. Protons are incident from below.
Figure 2
Figure 2. Uniformity of the scanning field and verification of distal edge placement.
(a) Dose profile along the central longitudinal axis in the isocenter plane, resulting from a 20 × 20 cm2 uniform scan pattern with 3.5-cm full-width at half-maximum (FWHM) spots spaced 1 cm apart, measured with a 1,020 chamber MatriXX system (IBA I’mRT MatriXX, Schwarzenbruck, Germany). The field width between the 98% and 100% dose levels is 12 cm. (b) Dose profile along the central lateral axis in the isocenter plane. The field width between the 98% and 100% dose levels is 13 cm and is along the direction of the wells of columns; the uniformity over the 7.2-cm extent of the 8 wells in each column is 99%–100%. (c) Schematic of the experimental setup for range verification. A stack of 12 EBT3 films (each 268 µm thick) was placed directly on top of an empty 96-well plate and exposed. (d) Optical densitometry measurements of individual films made through the center of the well rows indicated that the Bragg peak was at well column 9 for this film, the fourth in the stack. In addition to verifying the accuracy of penetration of protons, this experiment allowed us to determine the number of films needed to position one of the columns (number 9) at the Bragg peak and have three points of measurement in the high gradient distal fall-off.
Figure 3
Figure 3. High-throughput clonogenic assays of H460 and H1437 NSCLC cells.
(a) As a benchmark for our 96-well system, we compared cultures in that format, processed and counted with the IN Cell Analyzer 6000, with those in 6-well plates, counted manually. Characteristic images of each plate type are shown. (b) Representative images of a single well depicting high-content image processing. (c) Cell survival curves for individual plates of cells grown in 6-well or 96-well systems, exposed to 137Cs gamma irradiation, and scored by manual or automated processing. Curves were found to be not statistically different between the techniques (P = 0.315, extra sum-of-squares F test). Error bars represent standard error of the mean (s.e.m.). (d) Clonogenic survival plotted as a function of dose and LET for proton irradiation experiments with H460 cells. Error bars for dose were calculated by sensitivity analysis and SF with s.e.m. (e) Clonogenic survival as a function of dose and LET for proton experiments performed with H1437 cells. P < 0.0001 for comparisons of 0.9 keV/µm to ≥10.8 keV/µm, extra sum-of-squares F test.
Figure 4
Figure 4. Preliminary analysis of biological assays.
(a) RBE vs LET at 10% SF. A nonlinear trend between biological effect and LET was observed for both cell lines. RBE error was calculated by propagating the standard error of the α and β fits from Fig. 3 (Supplementary Table 1). (b) H460 cells were plated in glass-bottom 96-well plates, irradiated, and processed 2 hours later for γH2AX foci staining. Representative images are depicted. Comparing wells exposed to LETs and doses of 4.6 keV/μm, 2.9 Gy and 17.3 keV/μm, 1.7 Gy, the average nuclear foci per Gy was significantly increased in the high-LET samples (P < 0.0001, Mann-Whitney unpaired t test). Error bars represent the 95% confidence level.

Similar articles

Cited by

References

    1. Schulz-Ertner D. & Tsujii H. Particle radiation therapy using proton and heavier ion beams. J Clin Oncol 25, 953–964, 10.1200/JCO.2006.09.7816 (2007). - DOI - PubMed
    1. Allen A. M. et al. An evidence based review of proton beam therapy: the report of ASTRO's emerging technology committee. Radiother Oncol 103, 8–11, 10.1016/j.radonc.2012.02.001 (2012). - DOI - PubMed
    1. Wedenberg M. & Toma-Dasu I. Disregarding RBE variation in treatment plan comparison may lead to bias in favor of proton plans. Med Phys 41, 091706, 10.1118/1.4892930 (2014). - DOI - PubMed
    1. Halperin E. C. Particle therapy and treatment of cancer. Lancet Oncol 7, 676–685, 10.1016/s1470-2045(06)70795-1 (2006). - DOI - PubMed
    1. Combs S. E. et al. Comparison of carbon ion radiotherapy to photon radiation alone or in combination with temozolomide in patients with high-grade gliomas: explorative hypothesis-generating retrospective analysis. Radiother Oncol 108, 132–135, 10.1016/j.radonc.2013.06.026 (2013). - DOI - PubMed