. 2015 Jul;47(7):727-735.
doi: 10.1038/ng.3306. Epub 2015 May 18.

Genome-wide maps of recombination and chromosome segregation in human oocytes and embryos show selection for maternal recombination rates

Affiliations

Genome-wide maps of recombination and chromosome segregation in human oocytes and embryos show selection for maternal recombination rates

Christian S Ottolini et al. Nat Genet. 2015 Jul.

Abstract

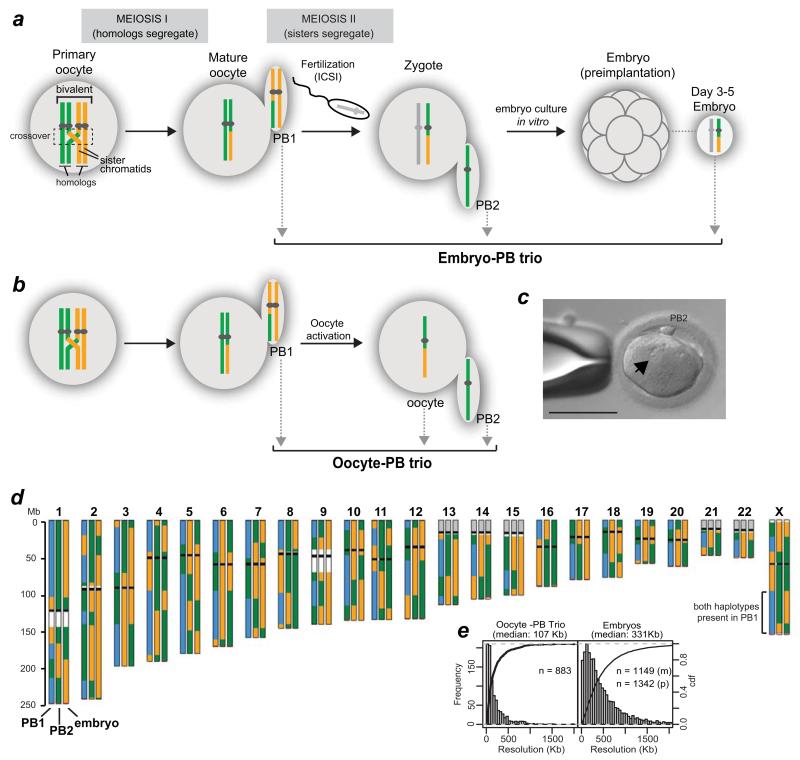
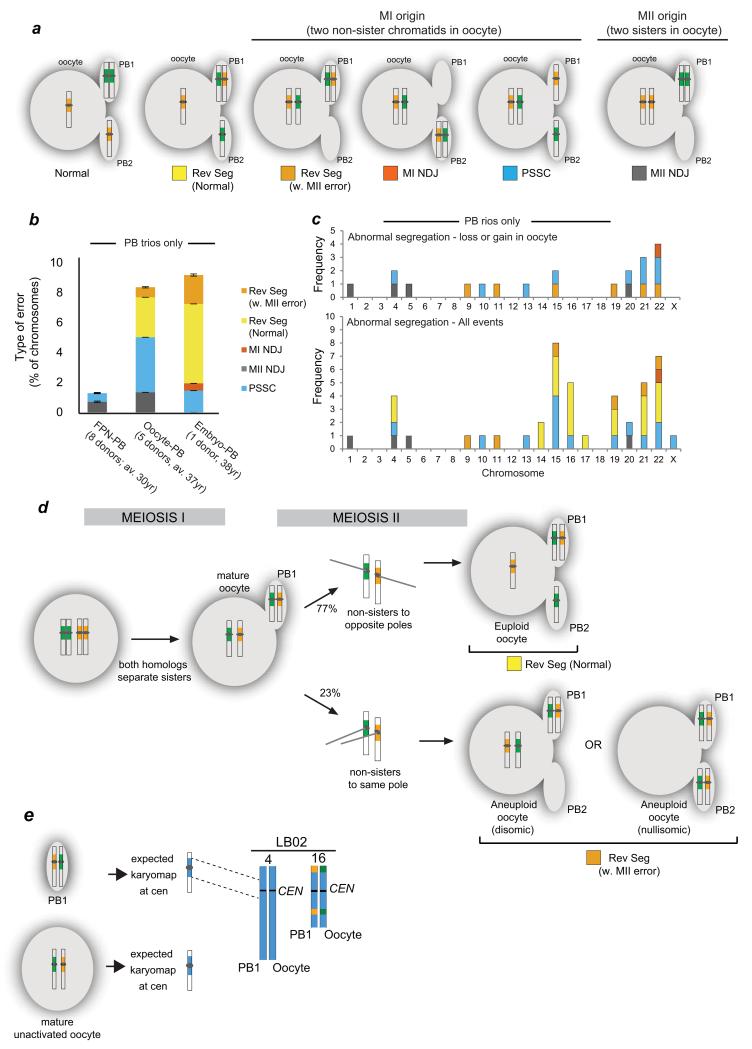
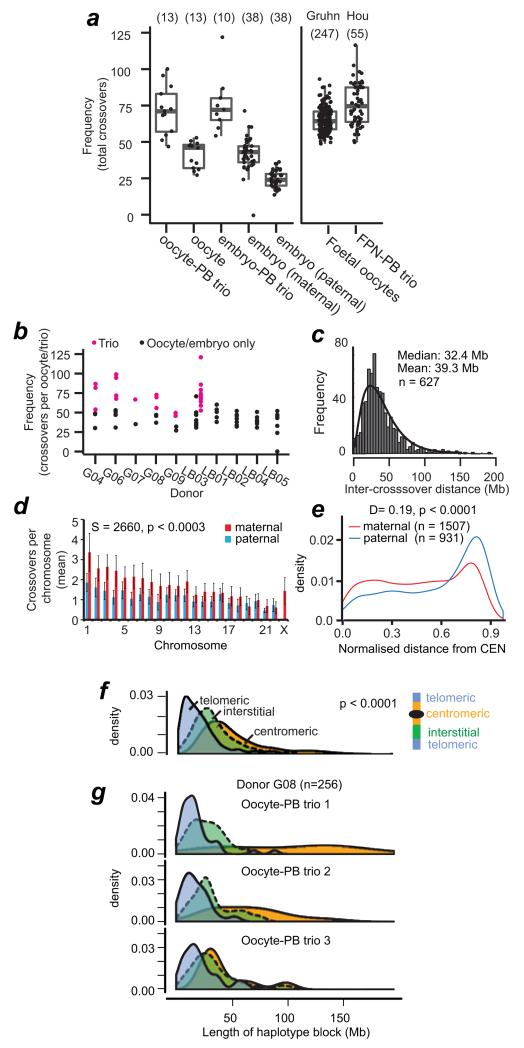
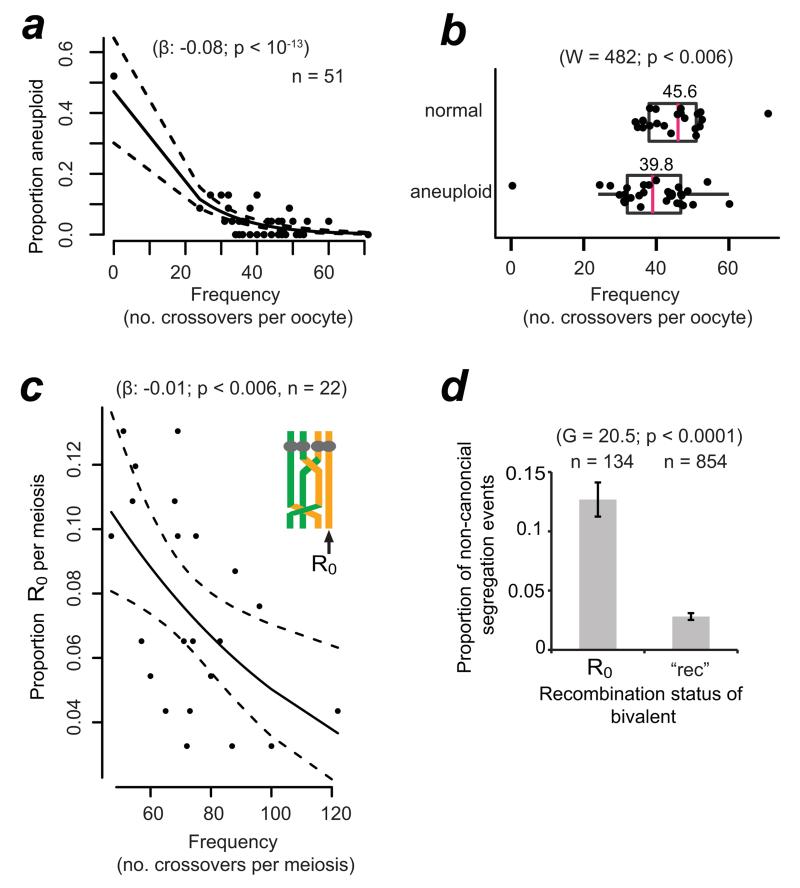
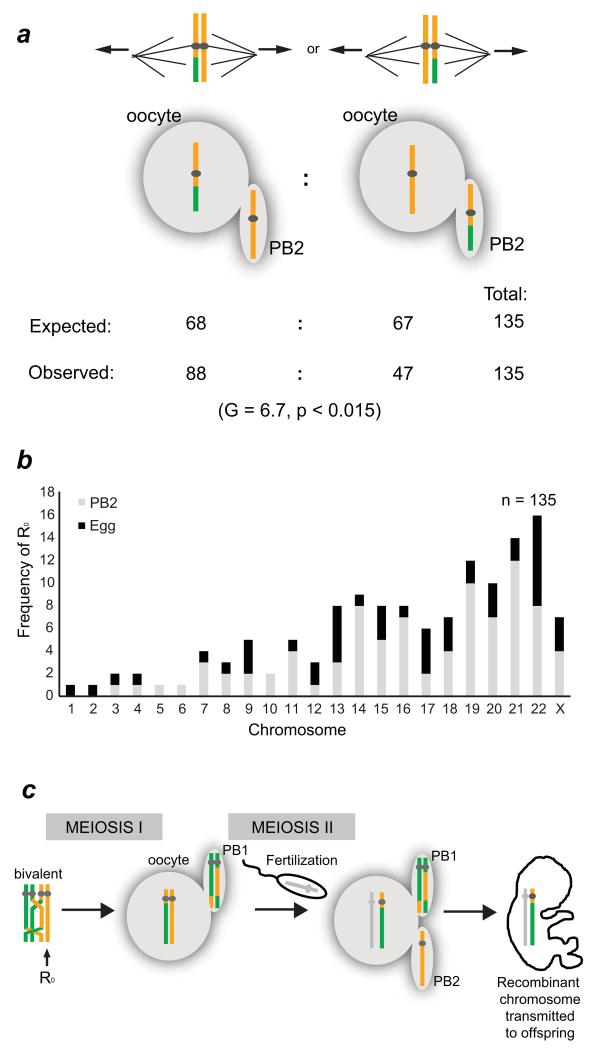
Crossover recombination reshuffles genes and prevents errors in segregation that lead to extra or missing chromosomes (aneuploidy) in human eggs, a major cause of pregnancy failure and congenital disorders. Here we generate genome-wide maps of crossovers and chromosome segregation patterns by recovering all three products of single female meioses. Genotyping >4 million informative SNPs from 23 complete meioses allowed us to map 2,032 maternal and 1,342 paternal crossovers and to infer the segregation patterns of 529 chromosome pairs. We uncover a new reverse chromosome segregation pattern in which both homologs separate their sister chromatids at meiosis I; detect selection for higher recombination rates in the female germ line by the elimination of aneuploid embryos; and report chromosomal drive against non-recombinant chromatids at meiosis II. Collectively, our findings show that recombination not only affects homolog segregation at meiosis I but also the fate of sister chromatids at meiosis II.


Figures

Figure 1
Figure 1
Human MeioMaps from embryos and oocytes together with their corresponding polar bodies. (a,b) The genotypes of the two maternal chromosomes are shown as green and yellow. Crossovers, shown in the dashed box, occurs during foetal development. The two polar bodies were sequentially biopsied (grey arrows) to avoid misidentification. Maternal MeioMaps were deduced from the embryo following intracytoplasmic sperm injection (ICSI) or directly assessed in the haploid oocyte, after artificial activation (b). (c) An activated oocyte with a single pronucleus (arrow) and PB2. Scale bar: 110 μm. (d) An example of a MeioMap after genome-wide SNP detection and phasing (see Methods). Each chromosome is represented by three vertical columns representing the three cells of the trio (PB1, PB2, and embryo or oocyte). The two phased maternal haplotypes are represented by green and yellow. Blue represents the detection of both haplotypes. Regions where SNPs are not available on the array are shown in white (repetitive sequences on chr. 1 and 9) or gray (rDNA). Black bars illustrate the position of the centromere. Red bars shows the last informative SNPs to call. Crossovers are manifested as reciprocal breakpoints in haplotypes (green to yellow, blue to green, etc.) in two of the three cells. Note that the colours of the haplotype blocks between different chromosomes are not necessarily derived from the same grandparent. Histograms of the resolution of the crossovers are shown in (e). The resolution was 352 Kb and 311 Kb for maternal (m) and paternal (p) crossovers in the embryos, respectively.
Figure 2
Figure 2
MeioMaps reveal origin of aneuploidies and a novel chromosome segregation pattern. (a) Segregation patterns revealed from following the pericentromeric haplotypes (yellow and green around centromere) in all three products of female meiosis. Only examples leading to trisomic conceptions are shown. For all possible segregation patterns detected by Meiomapping see Supplementary Figure 3. MI NDJ: meiosis I nondisjunction; Rev Seg reverse segregation; PSSC: precocious separation of sister chromatids; MII NDJ: meiosis II nondisjunction. (b) Incidence and type of segregation errors in oocyte-PB and embryo-PB trios. Errors detected in MeioMaps generated from the female pronucleus (FPN-PB) from a younger donor population are shown for comparison. The number of donors and average (av.) age are shown. Age ranges were 25-35 for FPN-PB and 33-41 for oocyte-PB trios. The embryo donor was 38 years (Supplementary Table 1 and 2). Bars: standard error of a proportion. (c) PB trios. (d) Inferred mode of reverse segregation (Rev Seg). Frequencies are shown in Table 2. Alternative segregation outcomes at meiosis II (euploid and aneuploid, n = 26; p < 0.025; binomial exact test with correction for continuity). (e) Detection of the inferred intermediate of reverse segregation, a mature oocyte and PB1 containing two non-sister chromatids each. Two mature oocytes that contained a PB1 but were unactivated were biopsied and the SNPs detected genome-wide. The expected chromosome fingerprints that contained heterozygous SNPs around the centromeres are shown in blue. Two examples were found in this egg (chromosomes 4 and 16; Table 2).
Figure 3
Figure 3
Variation in genome-wide recombination rates between and within individuals. (a) Boxplot of global recombination rates showing the interquartile range (box), median (horizontal bar), and whiskers (1.5× IQR). Numbers analysed are in parentheses. Rates from foetal oocytes (‘Gruhn’) and female pronucleus-PB trios (‘Hou’). (b) Recombination rates for the 10 donors. Black: rates using information from oocyte or embryo only. Magenta: rates using the information from the complete oocyte-PB trios. (c) Inter-crossover distances, excluding centromeric distances. The fitted curve is based on maximum likelihood estimation of the gamma distribution, shape: 2.6141 ± 0.14 (S.E.), rate 0.066 ± 0.0039 (S.E.). Estimated fitted mean: 39.3 Mb, log-likehood of fitting: −2802.738 ; AIC: 5609.476. (d) Average and standard deviation of chromosome-specific recombination (Supplementary Table 3). GLM analysis revealed that chromosome size had a significant effect on sex-specific recombination frequencies. Spearman correlation test is shown for the p-value for individual, pair-wise comparisons between maternal and paternal recombination frequencies per chromosome. As chromosome size decreases, the contribution of sex to crossover frequencies decreases (see Source Data for Fig. 3d). (e) Crossover position relative to centromeres (CEN), normalized to chromosome length. Statistics: Two-sided Kolmogorov-Smirnov test of normalized and absolute lengths; p < 0.0005; X chr. excluded; Supplementary Figure 5). (f) Length of haplotype blocks (not inter-crossover distances), according to position relative to telomeres (blue), centromeres (yellow), or interstitial (green). Statistics: non-parametric ANOVA (p < 0.0001). Centromeric blocks excluded the ~ 3 × 10⁶ base pairs of alpha-satellite DNA. (g) Variation in centromere repression of crossovers in oocyte-PB trios from the same donor.
Figure 4
Figure 4
Higher global recombination rates protect against aneuploidy and are selected for in the human female germline. (a) Logistic regression of the frequency of aneuploid chromosomes as a function of global recombination rate in the embryo or oocyte. Black lines shows logistic regression model and 95% confidence interval (dashed line; binomial family). When the outlier with 0 recombination events was omitted, the regression coefficient β was −0.06 and still highly significant (p < 0.003). The outlier was omitted from all subsequent statistical analyses. (b) Recombination rates in normal versus aneuploid oocytes and embryos. The arithmetic mean is shown above of the median (magenta, vertical bar). Statistics: Mann-Whitney-Wilcoxon test; one-sided. (c) Incidence of bivalents containing at least one non-recombinant chromatid (R0) as a function of global recombination rates in oocyte-PB and embryo-PB trios. Statistics as in (a). (d) Segregation errors amongst chromosomes that contained one or more R0 or where all four chromatids had recombined (‘rec’). p-values from G-test of heterogeneity (two-sided) are shown. Bars represent standard errors of a proportion (√[p ×(1−p)/n]).
Figure 5
Figure 5
Meiotic drive for recombinant chromatids at meiosis II increases recombination rates in the human female germline. (a) Sister chromatids are expected to segregate randomly at meiosis II. However, when chromosomes that contained one non-recombinant chromatid and one recombinant one segregated, the recombinant chromatid was twice as likely to segregate to the oocyte. G-test for proportions (two-sided). (b) Chromosome-specific frequencies of R0 chromatids segregating to the PB2 or oocyte. (c) Diagrammatic representation of meiotic drive against non-recombinant chromatids at meiosis II in the human female germline. Paternal chromosome is shown in gray.

Comment in

References

    1. Nagaoka SI, Hassold TJ, Hunt PA. Human aneuploidy: mechanisms and new insights into an age-old problem. Nat Rev Genet. 2012;13:493–504. - PMC - PubMed
    1. Hassold T, Hunt P. To err (meiotically) is human: the genesis of human aneuploidy. Nat Rev Genet. 2001;2:280–291. - PubMed
    1. Zaragoza MV, et al. Nondisjunction of human acrocentric chromosomes: studies of 432 trisomic fetuses and liveborns. Hum Genet. 1994;94:411–417. - PubMed
    1. Hassold TJ, Jacobs PA. Trisomy in man. Annu Rev Genet. 1984;18:69–97. - PubMed
    1. Hassold T, et al. A cytogenetic study of 1000 spontaneous abortions. Ann Hum Genet. 1980;44:151–178. - PubMed

Methods-only references

    1. Kuwayama M. Highly efficient vitrification for cryopreservation of human oocytes and embryos: the Cryotop method. Theriogenology. 2007;67:73–80. - PubMed
    1. Kuwayama M, Vajta G, Kato O, Leibo SP. Highly efficient vitrification method for cryopreservation of human oocytes. Reprod Biomed Online. 2005;11:300–308. - PubMed
    1. Wickham H. ggplot2: Elegant Graphics for Data Analysis. Use R. 2009:1–212.

Publication types