. 2015 Jul;47(7):822-826.
doi: 10.1038/ng.3292. Epub 2015 May 18.

Genome-wide patterns and properties of de novo mutations in humans

Affiliations

Genome-wide patterns and properties of de novo mutations in humans

Laurent C Francioli et al. Nat Genet. 2015 Jul.

Abstract

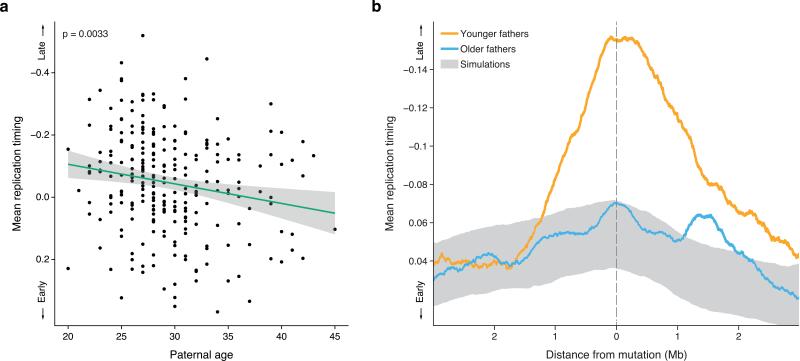
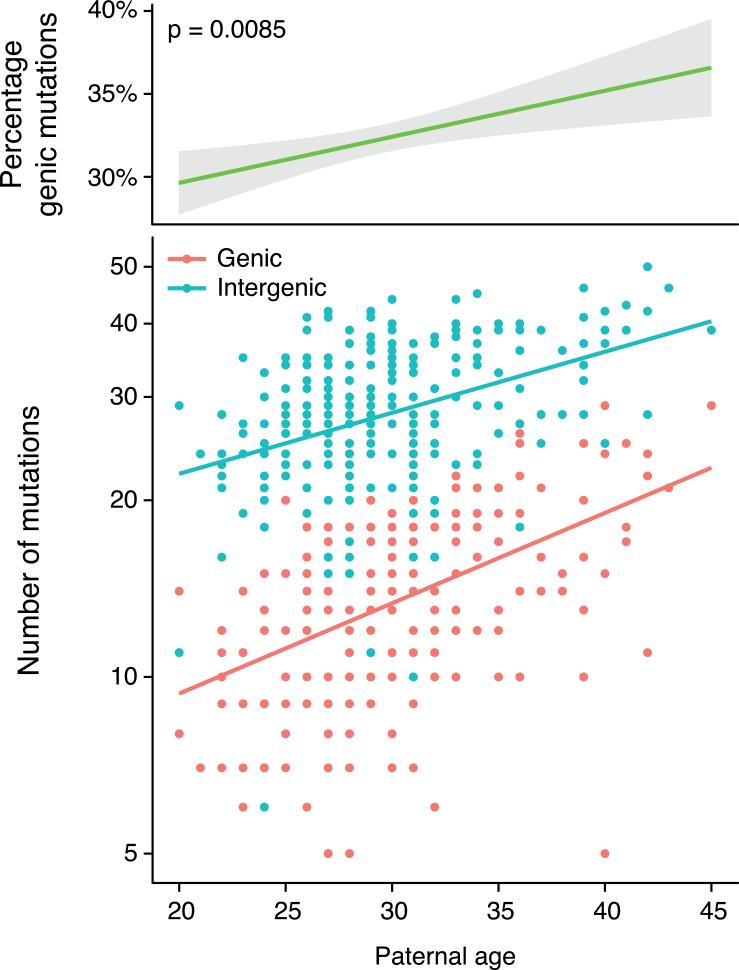
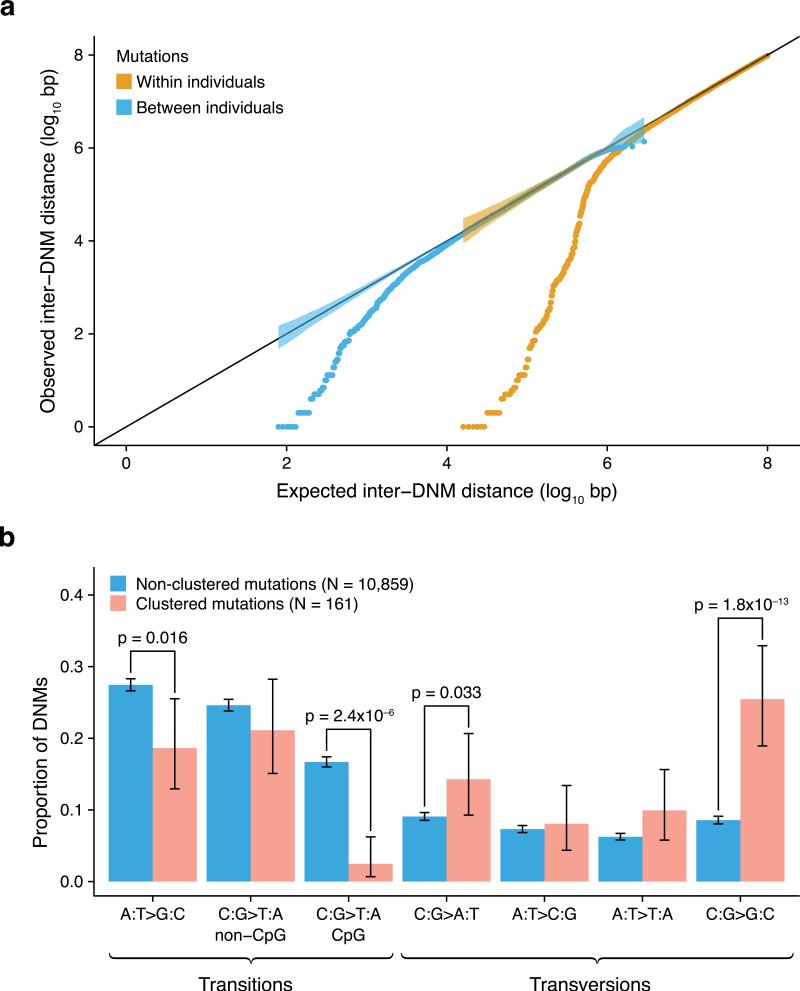
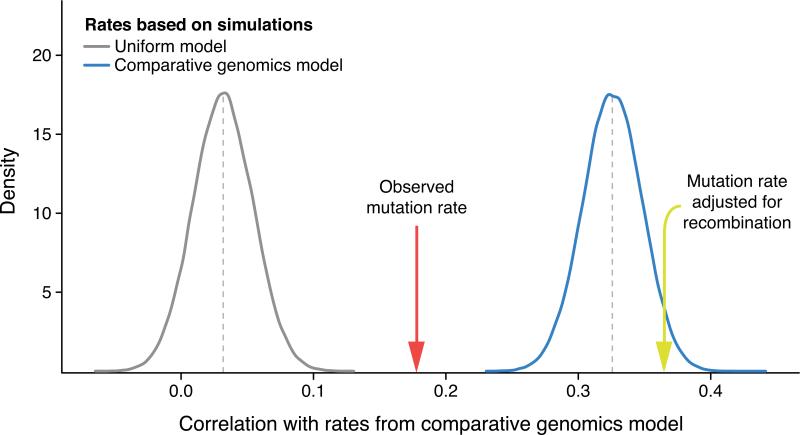
Mutations create variation in the population, fuel evolution and cause genetic diseases. Current knowledge about de novo mutations is incomplete and mostly indirect. Here we analyze 11,020 de novo mutations from the whole genomes of 250 families. We show that de novo mutations in the offspring of older fathers are not only more numerous but also occur more frequently in early-replicating, genic regions. Functional regions exhibit higher mutation rates due to CpG dinucleotides and show signatures of transcription-coupled repair, whereas mutation clusters with a unique signature point to a new mutational mechanism. Mutation and recombination rates independently associate with nucleotide diversity, and regional variation in human-chimpanzee divergence is only partly explained by heterogeneity in mutation rate. Finally, we provide a genome-wide mutation rate map for medical and population genetics applications. Our results provide new insights and refine long-standing hypotheses about human mutagenesis.


Figures

Fig. 1
Fig. 1. Mutations in offspring of younger fathers are biased towards later replicating regions
a. Mean replication timing of de novo mutations in each of the 258 offspring as a function of their father's age. The green line shows the least-square regression line (p = 0.0033) and the grey area the 95% confidence interval. The downward slope of the regression line indicates a shift of mutations towards earlier replicating regions with advancing paternal age. b. The mean replication timing profile around de novo mutations, stratified by paternal age (orange: under the age of 28, N = 3,697, blue: aged 28 or older, N = 7,323). The grey area shows the null expectation based on simulations (mean ±1 standard deviation). The age of the split between younger and older fathers was chosen to maximize the difference between the groups (p = 5.7 × 10⁻⁴, 23 tests). Mutations in younger fathers tend to be located in large (~2Mb) regions of late-replicating DNA. In contrast, the replication timing distribution of mutations in older fathers is similar to that of simulated mutations. Together, this shows that de novo mutations in offspring of younger fathers are biased towards late-replicating regions, while those in offspring of older fathers are not.
Fig. 2
Fig. 2. Offspring of older fathers harbor a higher percentage of de novo mutations in genes
Top panel: the percentage of de novo mutations within genic regions as a function of paternal age at conception (p = 0.0085, slope = 0.26% per year of paternal age). Bottom panel: the number of genic (red) and intergenic (blue) de novo mutations in offspring (on a logarithmic scale) as a function of paternal age. The red line shows the least-square regression for genic mutations (p < 2 × 10⁻¹⁶), the blue line for intergenic mutations (p = 3.7 × 10⁻¹⁴). The steeper slope of the regression line for genic mutations indicates a faster relative increase in genic than intergenic mutations with paternal age.
Fig. 3
Fig. 3. Mutation clusters exhibit a unique mutational spectrum
a. The distances between adjacent de novo mutations (observed) compared to a uniform distribution of mutations across the genome (expected). Closely spaced mutations are enriched both across individuals (brown) and within individuals (blue). The strength of this effect is strongest within individuals, where 78 mutation clusters of up to 20kb in size are observed. In fact, 1.5% of all de novo mutations in our study are in such clusters. Shaded areas represent the 95% confidence intervals. b. Comparison of mutation spectra between clustered (pink) and non-clustered (blue) de novo mutations (error bars indicate 95% CI). We defined mutation clusters as regions with two or more mutations within 20kb in the same individual. Mutations within clusters show a significantly reduced number of transitions (p = 1.2 × 10⁻¹² for all transitions, p = 4.1 × 10⁻⁶ when excluding C>T transitions at CpG sites) and a strongly elevated number of C→G transversions (p = 1.8 × 10⁻¹³), indicating a novel mutational mechanism.
Fig. 4
Fig. 4. Influence of mutation and recombination rates on human-chimpanzee divergence
The correlation to substitution rates computed from a human-chimpanzee comparative genomics (HCCG) model is plotted for mutation rates inferred from a uniform mutation rate model (grey distribution) and for mutation rates inferred from the HCCG model itself (blue distribution), both based on 100,000 simulations of N = 11,020 mutations and binned in 1Mb windows. By sampling the same number of mutations, comparisons between rate estimates are meaningful. The effect of sampling is illustrated by the mean correlation of the HCCG with itself at only 0.33, which would asymptotically reach unity with infinite sampling. The correlation is also given for observed de novo mutation rates (red arrow, N = 11,020) and observed de novo mutation rates adjusted for local recombination rates (yellow arrow, N = 11,020). Correlation with observed de novo mutation rates (r = 0.18) is stronger than correlations with rates based on the uniform model (mean r = 0.032, p < 1 × 10⁻⁵), indicating that the HCCG model partly captures regional mutation rate variations. However, the correlation with observed de novo mutation rates is weaker than correlations with rates based on the HCCG model itself (mean r = 0.33, p < 1 × 10⁻⁵), suggesting other contributing factors. When adjusting observed de novo mutation rates for local recombination rates, the correlation is 0.37, illustrating that substitution rates computed from the HCCG model capture both mutation rates and orthogonal evolutionary forces associated with local recombination rates.

References

    1. Sawyer SA, Hartl DL. Population genetics of polymorphism and divergence. Genetics. 1992;132:1161–76. - PMC - PubMed
    1. Felsenstein J, Churchill GA. A Hidden Markov Model approach to variation among sites in rate of evolution. Mol. Biol. Evol. 1996;13:93–104. - PubMed
    1. Siepel A, et al. Evolutionarily conserved elements in vertebrate, insect, worm, and yeast genomes. Genome Res. 2005;15:1034–50. - PMC - PubMed
    1. Cooper GM, et al. Distribution and intensity of constraint in mammalian genomic sequence. Genome Res. 2005;15:901–13. - PMC - PubMed
    1. Veltman J, Brunner H. De novo mutations in human genetic disease. Nat. Rev. Genet. 2012;13:565–75. - PubMed

Publication types