. 2015 May 12;15(5):11076-91.
doi: 10.3390/s150511076.

MMP-2/9-Specific Activatable Lifetime Imaging Agent

Affiliations

MMP-2/9-Specific Activatable Lifetime Imaging Agent

Marcus T M Rood et al. Sensors (Basel). .

Abstract

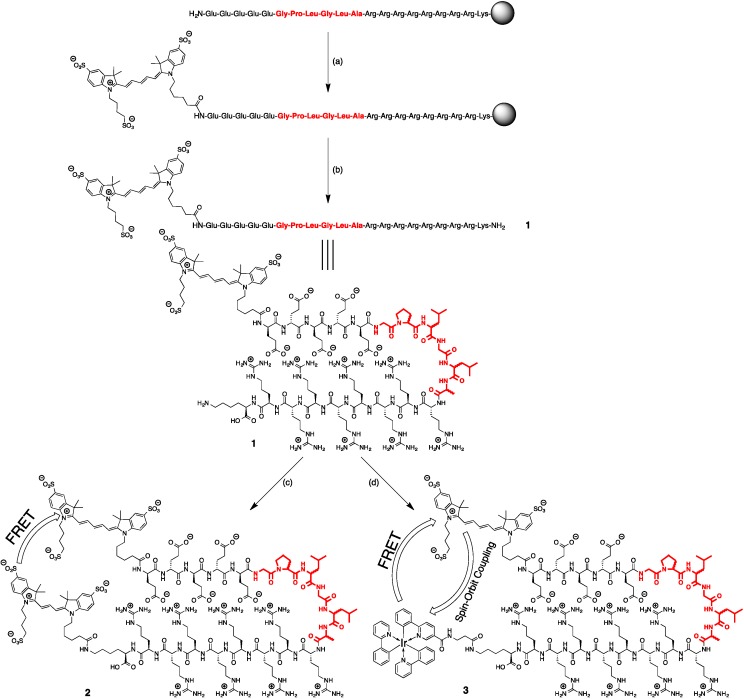
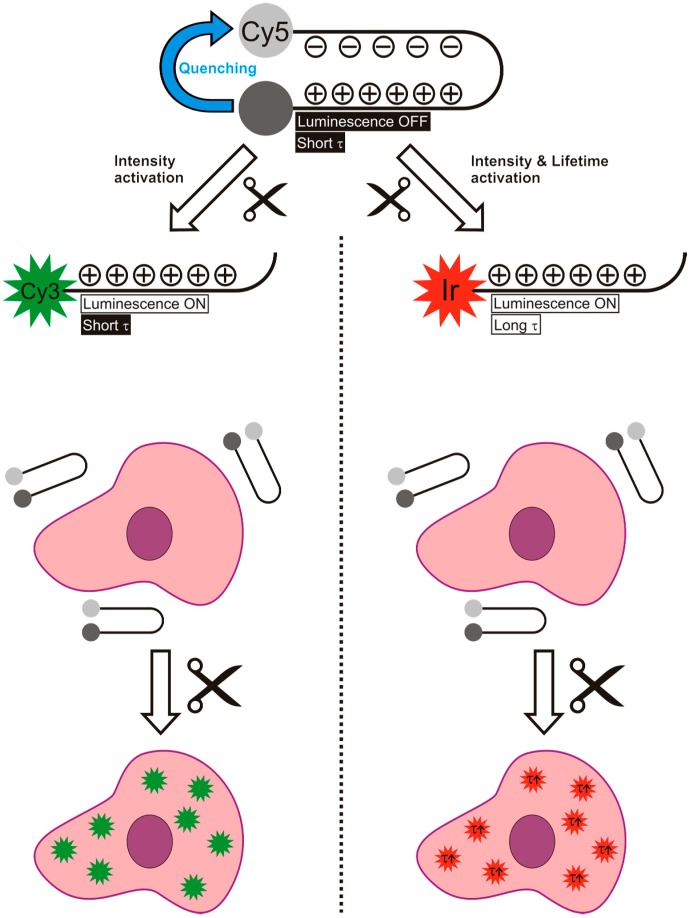
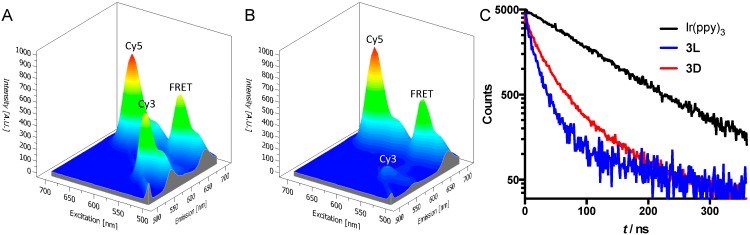
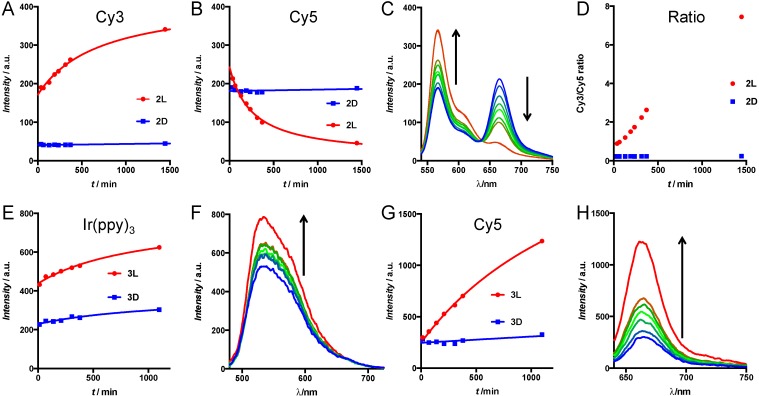
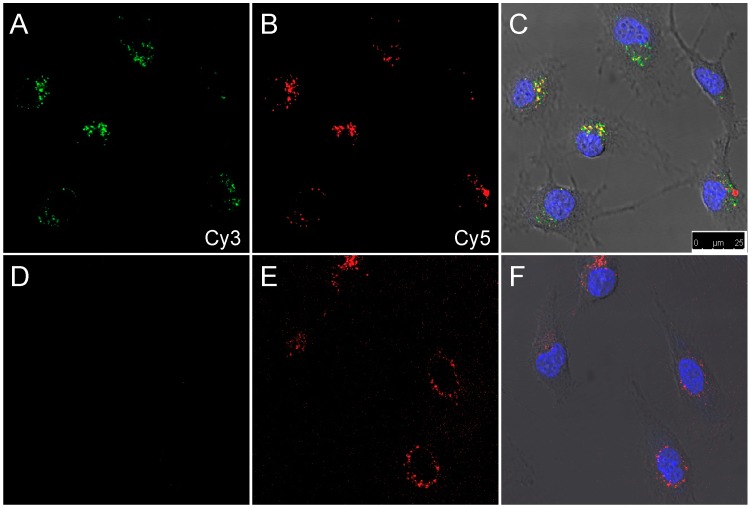
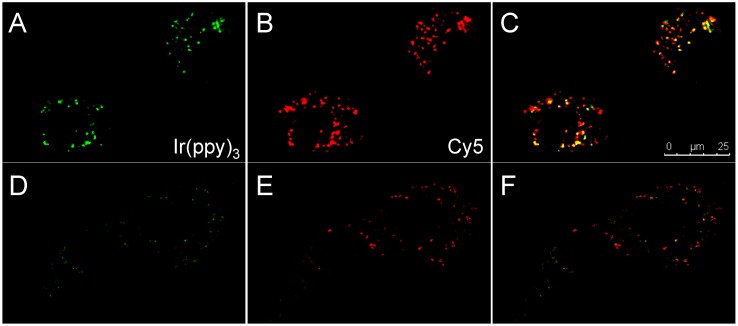
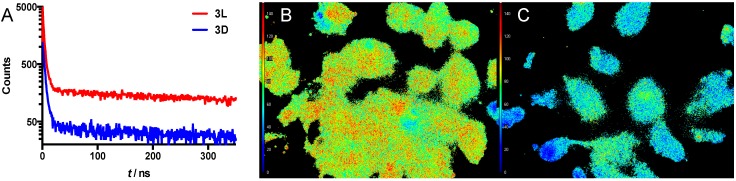
Optical (molecular) imaging can benefit from a combination of the high signal-to-background ratio of activatable fluorescence imaging with the high specificity of luminescence lifetime imaging. To allow for this combination, both imaging techniques were integrated in a single imaging agent, a so-called activatable lifetime imaging agent. Important in the design of this imaging agent is the use of two luminophores that are tethered by a specific peptide with a hairpin-motive that ensured close proximity of the two while also having a specific amino acid sequence available for enzymatic cleavage by tumor-related MMP-2/9. Ir(ppy)3 and Cy5 were used because in close proximity the emission intensities of both luminophores were quenched and the influence of Cy5 shortens the Ir(ppy)3 luminescence lifetime from 98 ns to 30 ns. Upon cleavage in vitro, both effects are undone, yielding an increase in Ir(ppy)3 and Cy5 luminescence and a restoration of Ir(ppy)3 luminescence lifetime to 94 ns. As a reference for the luminescence activation, a similar imaging agent with the more common Cy3-Cy5 fluorophore pair was used. Our findings underline that the combination of enzymatic signal activation with lifetime imaging is possible and that it provides a promising method in the design of future disease specific imaging agents.

Keywords: FRET; MMP; enzymatic activation; fluorescence; iridium; lifetime imaging; luminescence.


Figures

Scheme 1
Scheme 1
Synthesis of the activatable imaging agents discussed in this research. (a) Cy5, PyBOP, DIPEA, DMF; (b) TFA, H2O, TIS; (c) Cy3-NHS, H2O/DMSO; (d) Ir(ppy)3-β-Ala-COOH, DCC, NHS, H2O/DMSO. The amino acid sequence for cleavage is highlighted in red and comprised of either l-amino acid or d-amino acids. All other amino acids used to generate these structures were d-amino acids.
Figure 1
Figure 1
Schematic overview of the difference between the use of an activatable luminescence imaging agent (left) and an activatable lifetime imaging agents (right), both based on a hairpin motive. It is important to note that in the case of lifetime activation not only the intensity increases, but also the lifetime. This gives two parameters to follow the activation reaction.
Figure 2
Figure 2
(A,B) Excitation-emission plots of peptides 2L (A) and 2D (B). The peaks labeled as “FRET” are the peaks that show acceptor emission (670 nm) with donor excitation (550 nm); (C) Luminescence decay traces at 600 nm of 3L, 3D, and reference compound Ir(ppy)3-COOH in water. All compounds were excited with a 372 nm laser at 2.5 MHz.
Figure 3
Figure 3
(AD) Cleavage assay of 2L and 2D by MMP-expressing cells (A,B) Emission intensity from peptides 2L (red circles) and 2D (blue squares) of the donor peak (Cy3, excitation 525 nm, emission 566 nm) (A) and the FRET peak (Cy5, excitation 525 nm, emission 666 nm) (B) in time; (C) Variations in emission spectra (excitation 525 nm) of 2L in time from blue (first time point) to red (last time point) and (D) the donor/acceptor ratio; (EH) Cleavage assay of 3L and 3D by MMP-expressing cells; (E,G) Emission intensity changes from peptides 3L (red circles) and 3D (blue squares) of the peaks at 590 nm (E) and 666 nm (G) in time; (F,H) Change in emission of these peaks of 3L in time from blue (first time point) to red (last time point) with excitation at 420 nm (F) or 625 nm (H). Arrows indicate change in time.
Figure 4
Figure 4
Confocal images of SKOV-3 cells after 24 h incubation with 2L (AC) or 2D (DF). (A,D) Cy3 channel in green; (B,E) Cy5 channel in red; (D,F) Overlay of differential interference contrast, nuclear stain (Hoechst 33342, blue), Cy3 (green), and Cy5 (red). Excitation and emission wavelengths are described in the Experimental Section.
Figure 5
Figure 5
Confocal images of SKOV-3 cells after 24 h incubation with 3L (AC) or 3D (DF). (A,D) Ir(ppy)3 channel in green; (B,E) Cy5 channel in red; (C,F) Overlay of both channels. Yellow means colocalization of red and green.
Figure 6
Figure 6
(A) Luminescence decay traces of a suspension of SKOV-3 cells after 24 h incubation with 3L (red) or 3D (blue); (B) FLIM image of cells incubated with 3L; (C) FLIM image of cells incubated with 3D. The scalebar on the left depicts τ, going from 0 ns (blue) to 150 ns (red).

References

    1. Rao J., Dragulescu-Andrasi A., Yao H., Yao H. Fluorescence imaging in vivo: Recent advances. Curr. Opin. Biotechnol. 2007;18:17–25. doi: 10.1016/j.copbio.2007.01.003. - DOI - PubMed
    1. Monici M. Cell and tissue autofluorescence research and diagnostic applications. Biotechnol Annu Rev. 2005;11:227–256. - PubMed
    1. Billinton N., Knight A.W. Seeing the wood through the trees: A review of techniques for distinguishing green fluorescent protein from endogenous autofluorescence. Anal. Biochem. 2001;291:175–197. doi: 10.1006/abio.2000.5006. - DOI - PubMed
    1. Berezin M.Y., Achilefu S. Fluorescence lifetime measurements and biological imaging. Chem. Rev. 2010;110:2641–2684. doi: 10.1021/cr900343z. - DOI - PMC - PubMed
    1. Hennig A., Roth D., Enderle T., Nau W.M. Nanosecond time-resolved fluorescence protease assays. Chembiochem. 2006;7:733–737. doi: 10.1002/cbic.200500561. - DOI - PubMed

Publication types

MeSH terms

LinkOut - more resources