. 2015 Jun 18;522(7556):349-53.
doi: 10.1038/nature14407. Epub 2015 May 18.

MET is required for the recruitment of anti-tumoural neutrophils

Affiliations

MET is required for the recruitment of anti-tumoural neutrophils

Veronica Finisguerra et al. Nature. .

Abstract

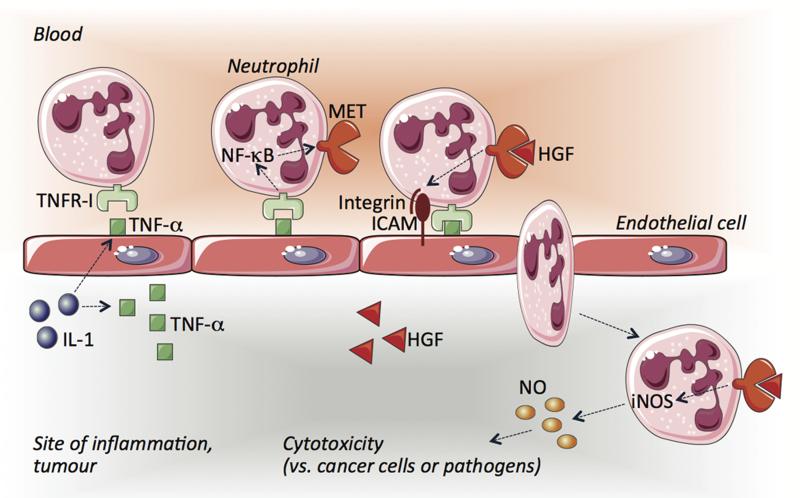
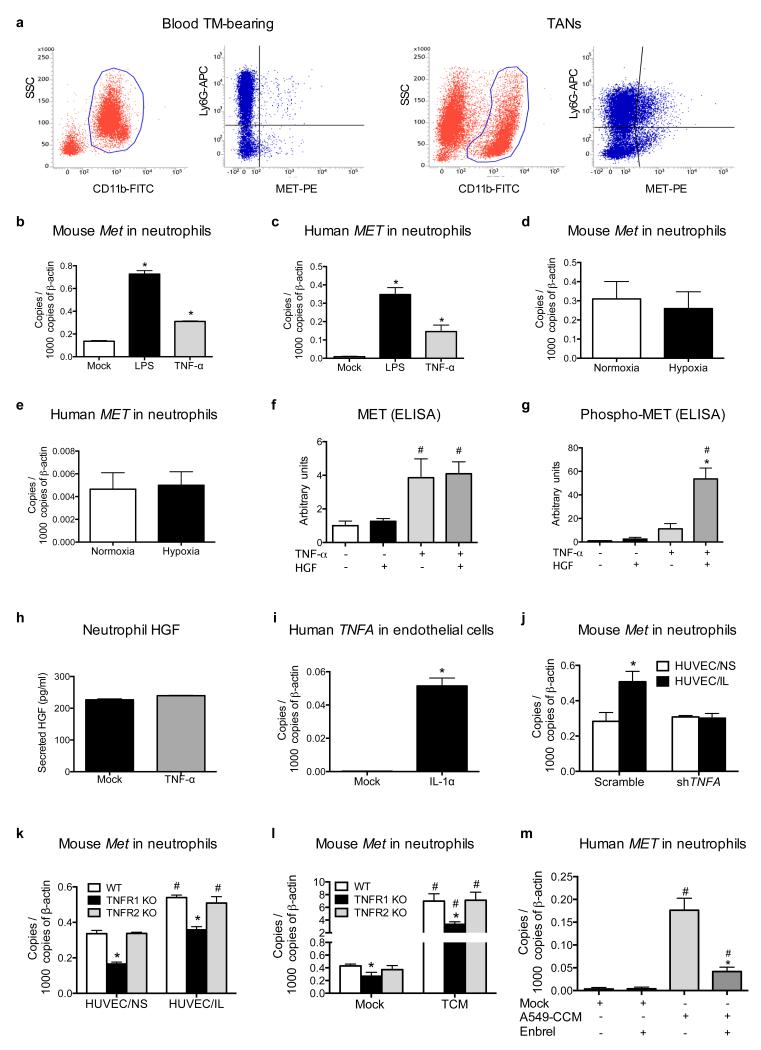
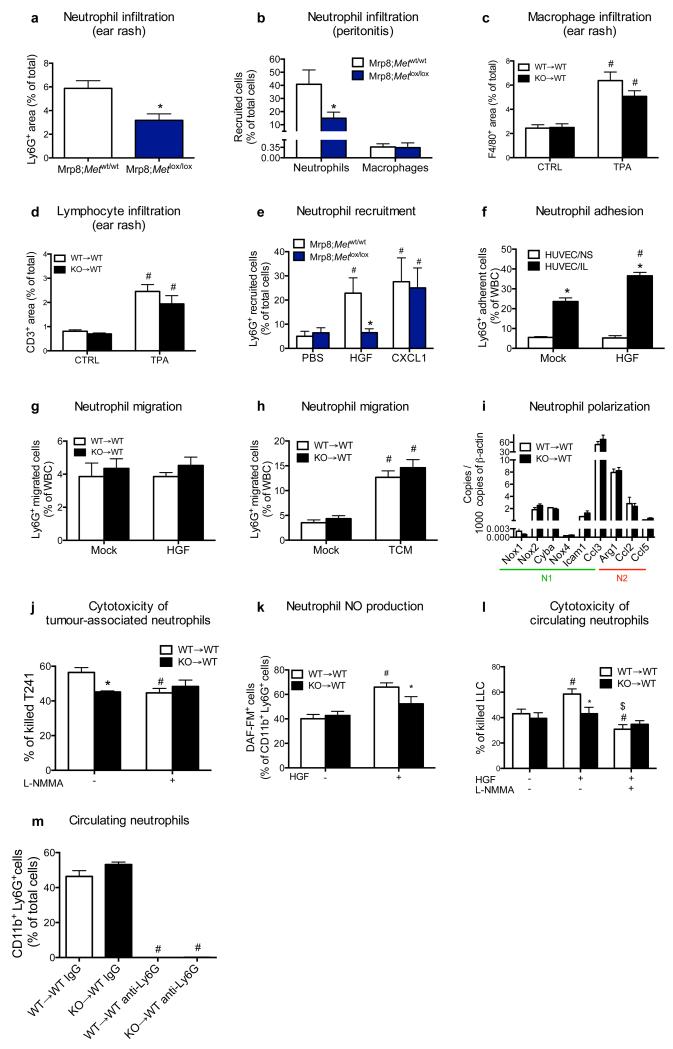
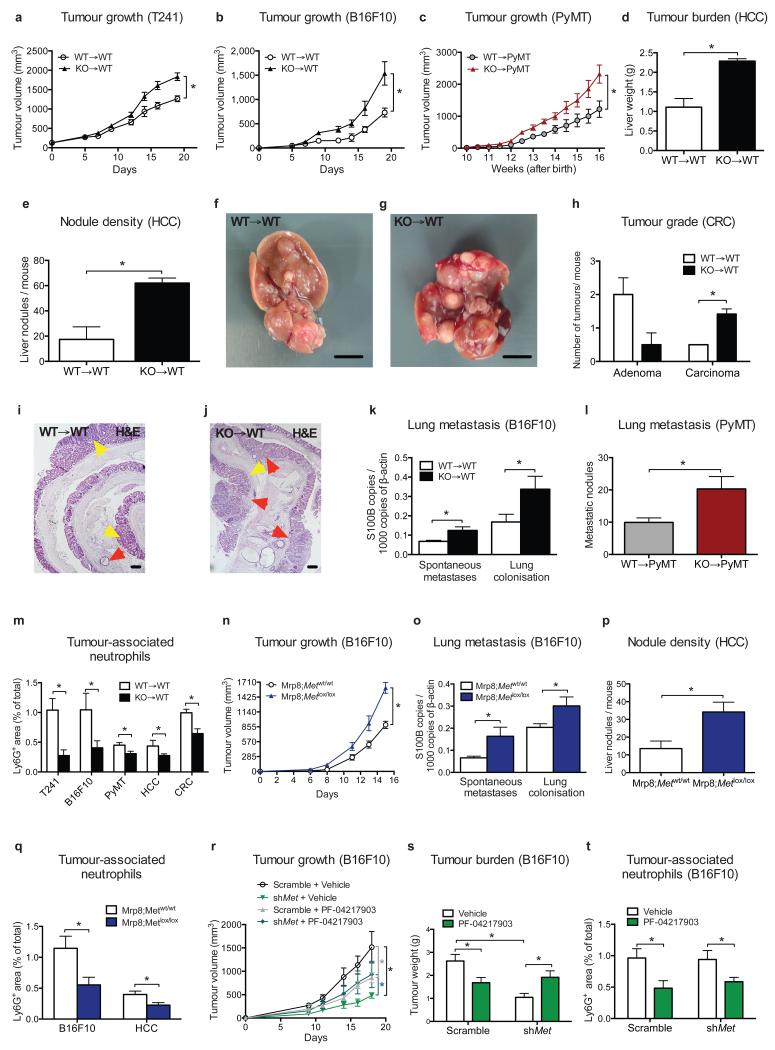
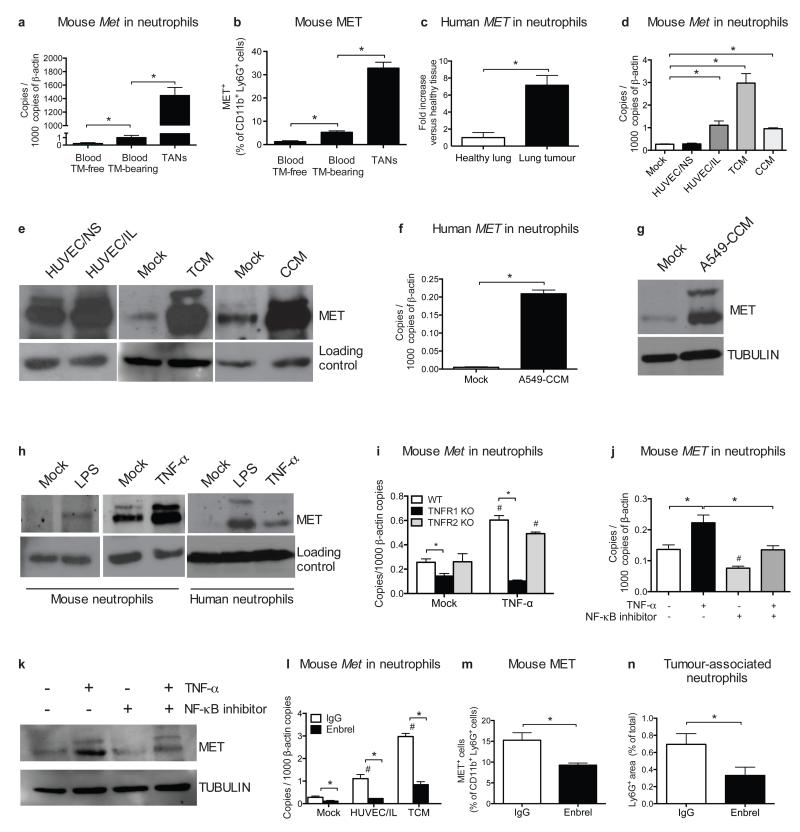
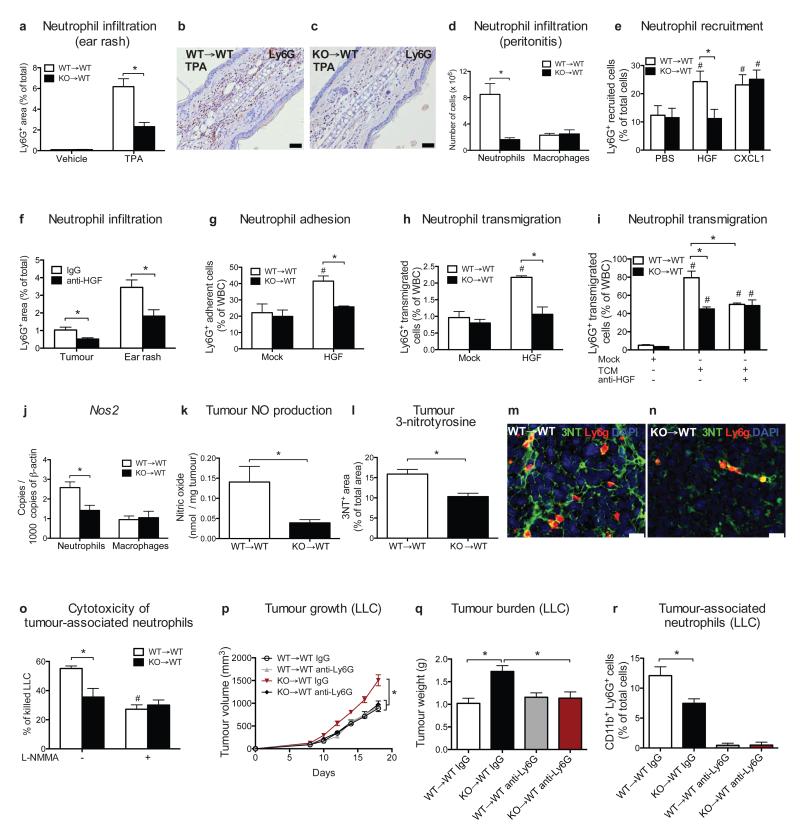
Mutations or amplification of the MET proto-oncogene are involved in the pathogenesis of several tumours, which rely on the constitutive engagement of this pathway for their growth and survival. However, MET is expressed not only by cancer cells but also by tumour-associated stromal cells, although its precise role in this compartment is not well characterized. Here we show that MET is required for neutrophil chemoattraction and cytotoxicity in response to its ligand hepatocyte growth factor (HGF). Met deletion in mouse neutrophils enhances tumour growth and metastasis. This phenotype correlates with reduced neutrophil infiltration to both the primary tumour and metastatic sites. Similarly, Met is necessary for neutrophil transudation during colitis, skin rash or peritonitis. Mechanistically, Met is induced by tumour-derived tumour necrosis factor (TNF)-α or other inflammatory stimuli in both mouse and human neutrophils. This induction is instrumental for neutrophil transmigration across an activated endothelium and for inducible nitric oxide synthase production upon HGF stimulation. Consequently, HGF/MET-dependent nitric oxide release by neutrophils promotes cancer cell killing, which abates tumour growth and metastasis. After systemic administration of a MET kinase inhibitor, we prove that the therapeutic benefit of MET targeting in cancer cells is partly countered by the pro-tumoural effect arising from MET blockade in neutrophils. Our work identifies an unprecedented role of MET in neutrophils, suggests a potential 'Achilles' heel' of MET-targeted therapies in cancer, and supports the rationale for evaluating anti-MET drugs in certain inflammatory diseases.


Figures

Extended Data Figure 1
Extended Data Figure 1. Scheme illustrating the role of MET in neutrophils
During cancer or infections, the release of cytokines such as IL-1 at the inflammatory site will promote the expression of TNF-α on the endothelium and the surrounding tissue. When circulating neutrophils will encounter the activated endothelium, TNF-α will unleash NF-κB through the binding to TNFR1, which in turn will induce MET expression on neutrophil surface. HGF, also released and proteolytically activated at the site of inflammation, will bind to MET and stimulate the firm adhesion of neutrophils to the endothelium, likely via integrin engagement, and thus neutrophil diapedesis. Once extravasated, HGF/MET pathway will still function on neutrophils by reinforcing their cytotoxic response through the induction of iNOS and NO production, ultimately favouring a bactericidal and tumouricidal neutrophil phenotype.
Extended Data Figure 2
Extended Data Figure 2. Met deletion in immune cells, but not in EC, fosters tumour growth
a, MET expression in total bone marrow (BM) cells, endothelial cells (EC) and neutrophils harvested from Met floxed mice intercrossed with the Tie2:Cre deleter thus generating Tie2;Metlox/lox (KO) or Tie2;Metwt/wt (WT) mice. Western blots are representative of 3 repetitions on independent biological replicates. Western blot images have been cropped for presentation. Full scan images are shown in Supplementary Figure 1. b-d, Quantification (b) and representative images of tumour sections’ TUNEL stainings (c,d) from subcutaneous endstage LLC tumours in WT→WT and KO→WT mice. Data combine 2 independent experiments; total n=10 mice/condition. e, FACS quantification of AnnexinV+ 7AAD early apoptotic tumour cells in WT→WT and KO→WT mice. Data combine 2 independent experiments; total n=8 mice/condition. f-j, Tumour necrosis quantification in WT→WT and KO→WT mice (f), assessed by histologic evaluation of H&E stained tumour sections (g,h) and by measurement of autofluorescent tumour areas (i,j); yellow dotted lines demarcate necrosis. Data combine 2 independent experiments; total n=10 mice/condition. k-m, Quantification (k) and representative images of tumour sections stained for the proliferation marker pHH3 (l,m) from subcutaneous endstage LLC tumours in WT→WT and KO→WT mice. Data combine 2 independent experiments; total n=10 mice/condition. n, FACS quantification of BrdU+ proliferating tumour cells in WT→WT and KO→WT mice. Data combine 2 independent experiments; total n=10 mice/condition. o-r, CD31+ vessel area (o), vessel density (p), lectin perfusion (q), and hypoxic (Pimo+) area (r) in LLC subcutaneous tumours from KO→WT mice (where the hematopoietic/immune system is knocked out for Met) or WT→KO mice (where EC only are knocked out for Met) compared to control WT→WT mice. Data in o-r combine 2 independent experiments; total n: WT→WT=12, KO→WT=8, WT→KO=8. s-u, Subcutaneous LLC tumour growth (s), weight (t) and lung metastases (u) in Tie2;Metlox/lox compared to Tie2;Metwt/wt mice. Data combine 2 independent experiments; total n: Tie2;Metwt/wt=12, Tie2;Metlox/lox=10. v, Tumour growth in endothelial cell specific Met KO (WT→KO) and control (WT→WT) mice. Data combine 2 independent experiments; total n=8/condition. *, P<0.05 versus WT→WT (b,e,f,k,n), versus Tie2;Metwt/wt (s-u). Scale bars: 50 μm (c,d,l,m), 100 μm (g-j). All graphs show mean ± s.e.m.
Extended Data Figure 3
Extended Data Figure 3. Circulating and tumour-infiltrating immune cells upon Met deletion
a-e, FACS analysis showing percentages of circulating monocytes (a), lymphocytes (b), neutrophils (c), eosinophils (d), and basophils (e) in tumour free or in LLC-tumour bearing WT→WT and KO→WT mice. Data combine 2 independent experiments; total n=8 mice/condition. f, Quantification of LLC-tumour sections stained for the pan-leukocyte marker CD45, the macrophage marker F4/80, the NK marker NK1.1, the B lymphocyte marker CD45R, the T helper cell marker CD4, the cytotoxic T cell marker CD8 and the dendritic cell marker CD11c (with exclusion of F4/80+ area) in WT→WT and KO→WT mice. Data combine 2 independent experiments; total n=8 mice/condition). g,h, FACS quantification for tumour-associated CD45+ leukocytes (g) or CD45+ IgE+ CD49b+ CD4 CD45R basophils and CD45+ CD11b+ SiglecF+ Ly6Cmed F4/80low MHCII eosinophils (h) in WT→WT and KO→WT mice. Data combine 2 independent experiments; total n=8 mice/condition. i,j, FACS quantification (i) and gating strategy (j) for tumour-associated neutrophils selected from the main tumour cell population negative for 7AAD staining; tumour-associated neutrophils were then gated as CD11b and Ly6G double positive cells. Data combine 2 independent experiments; total n: WT→WT=11, KO→WT=10. k, Ly6G+ tumour infiltration at day 9, day 13, and day 19 after LLC subcutaneous tumour injection in WT→WT and KO→WT mice. Data combine 2 independent experiments; total n=8 mice/condition. l, Morphometric quantification of leukocytes and macrophages on respectively CD45 and F480-stained lung sections from LLC tumour-bearing WT→WT or KO→WT mice. Data combine 2 independent experiments; total n=8 mice/condition. m, FACS quantification of CD11b+ Ly6G+ neutrophils and CD11b+ F4/80+ macrophages infiltrating metastatic lungs from LLC tumour-bearing WT→WT or KO→WT mice. Data combine 2 independent experiments; total n=8 mice/condition. *, P<0.05 versus WT→WT (f,g,i,k-m); #, P<0.05 versus Tumour free (a-d). All graphs show mean ± s.e.m.
Extended Data Figure 4
Extended Data Figure 4. MET in neutrophils is required for their anti-tumour activity
a,b, Western blot analysis (a) and relative densitometric analysis (b) for MET expression in BM neutrophils and monocytes upon reconstitution of WT recipient mice by WT or KO HSPCs transduced in vitro with an empty vector (Mrp8:Empty) or a vector expressing Met under the neutrophil-specific promoter Mrp8 (Mrp8:Met); tubulin was used as loading control. Western blots are representative of 3 repetitions on independent biological samples where each sample is the pool of neutrophils or monocytes isolated from 3 mice. Densitometric analysis has been performed on these 3 Western blots. c, FACS analysis for GFP in circulating Ly6G+ neutrophils or CD115+ monocytes, harvested from the neutrophil-specific Mrp8:Cre line carrying separate expression of GFP because of an Internal Ribosome Entry Site (IRES) downstream the Mrp8-driven Cre gene. Data combine 2 independent experiments; total n=10 mice/condition. d, MET expression in neutrophils, monocytes, and macrophages harvested from Mrp8;Metwt/wt or Mrp8;Metlox/lox mice. Western blots are representative of 3 repetitions on independent biological replicates. e, FACS analysis for CD11b+ Ly6G+ neutrophils in subcutaneous LLC tumours from Mrp8;Metwt/wt or Mrp8;Metlox/lox. Data combine 2 independent experiments; total n: Mrp8;Metwt/wt=10, Mrp8;Metlox/lox=11. Western blot images in (a,d) have been cropped for presentation. Full scan images are shown in Supplementary Figure 1. *, P<0.05 versus Mrp8:Empty WT→WT (b), versus Mrp8;Metwt/wt (e); #, P<0.05 versus Mrp8:Empty WT→WT; $, P<0.05 versus Mrp8:Empty KO→WT. All graphs show mean ± s.e.m.
Extended Data Figure 5
Extended Data Figure 5. Pharmacologic and genetic inhibition of MET prevents the recruitment of anti-tumoural neutrophils to several neoplastic tissues and inflammatory sites
a, Tumour weight of subcutaneous B16F10 melanomas in WT→WT and KO→WT mice. Data combine 2 independent experiments; total n: WT→WT=8, KO→WT=9. b,c, Total tumour weight (b) and metastatic index (c) in MMTV-PyMT mice reconstituted with WT or Met KO BM cells before tumour appearance (WT→PyMT and KO→PyMT mice, respectively). Data combine 3 independent experiments; total n: WT→PyMT=13, KO→PyMT=16. d,e, FACS quantification for CD11b+ Ly6G+ neutrophils in T241 tumours harvested from WT→WT or KO→WT mice (d) or in in breast tumours spontaneously grown in WT→PyMT and KO→PyMT mice (e). Data combine 2 independent experiments; total n=10 mice/condition (d) or total n=8 mice/condition (e). f-i, Length measurement (f) and representative image (g) of the colon, as well as quantification of neutrophils (h) and macrophages (i) on bowel sections, from WT→WT and KO→WT mice upon induction of chronic colitis compared to healthy control. Data combine 2 independent experiments; total n: healthy=5, WT→WT=12, KO→WT=15. j,k, Tumour weight (j) and metastatic mesenteric lymph nodes (k) 12 days after orthotopic injection of pancreatic Panc02 cancer cells in WT→WT and KO→WT mice. Data combine 2 independent experiments; total n=12/condition. l, Histological quantification of Ly6G+ infiltrates in Panc02 pancreatic tumours harvested from WT→WT and KO→WT mice. Data combine 2 independent experiments; total n=12 mice/condition. m, Quantification of plasma HGF in tumour (TM)-free mice, in subcutaneous LLC or orthotopic Panc02 tumour-bearing mice. Data combine 2 independent experiments; total n: TM free=10, LLC=10, Panc02=8 biological replicates. n, Quantification of HGF in subcutaneous LLC or orthotopic Panc02 tumours. Data combine 2 independent experiments; total n: LLC=10, Panc02=8 biological replicates. o,p, Quantification of HGF in plasma (o) or in subcutaneous LLC tumours (p) from tumour-bearing WT→WT and KO→WT mice. Data are representative of 2 independent experiments using 5 mice/condition per experiment. q, Quantification of Ly6G+ area on sections from B16F10 melanomas grown in C57BL/6 WT mice, daily treated with PF-04217903, INCB28060, JNJ-38877605, or vehicle as control. Data combine 2 independent experiments; total n: vehicle=14, PF-04217903=9, INCB28060=6, JNJ-38877605=4. r, Western blot analysis for MET in B16F10 melanoma cells after transduction with a lentiviral vector encoding scramble or mouse shMet under a constitutive promoter; vinculin was used as loading control. Western blot is representative of 3 independent repetitions. Western blot images have been cropped for presentation. Full scan images are shown in Supplementary Figure 1. *, P<0.05 versus WT→WT (a,d,h), versus WT→PyMT (b,e), versus LLC (m,n), versus Vehicle (q); #, P<0.05 versus Healthy (f,h,i), versus TM free (m). Scale bar: 10 mm (g). All graphs show mean ± s.e.m.
Extended Data Figure 6
Extended Data Figure 6. HGF is required for MET activation upon induction by TNF-α
a, Gating strategy related to Fig. 3b to quantify MET expression in blood neutrophils from LLC-tumour (TM)-bearing mice and in TANs, where live cells were first gated as CD11b positive cells; this population was finally gated for Ly6G and MET in order to identify MET-expressing Ly6G+ neutrophils. b,c, qRT-PCR for MET in mouse (b) and human (c) neutrophils after LPS or TNF-α stimulation. Data are representative of 3 independent experiments using 4 biological replicates/condition per experiment. d,e, qRT-PCR for MET expression in mouse (b) or human (c) neutrophils cultured in normoxia (21% O2) or hypoxia (1% O2). Data combine 2 independent experiments; total n=8 biological replicates/condition. f,g, ELISA for total MET (f) and phospho-MET (g) from mouse neutrophils stimulated for 3 minutes with mock medium or HGF after an overnight incubation with or without TNF-α. Data combine 3 independent experiments; total n=6 biological replicates/condition. h, HGF release by neutrophils stimulated with mock medium or TNF-α after 20 hours in culture. Data combine 2 independent experiments; total n=6 biological replicates/condition. i, qRT-PCR for TNFA in HUVEC upon stimulation with IL-1α compared to mock medium. Data combine 2 independent experiments; total n=4 biological replicates/condition. j, qRT-PCR for Met in mouse neutrophils co-cultured with HUVEC/NS or HUVEC/IL transduced with shTNFA or scramble as control. Data are representative of 3 independent experiments where 3 different shRNA sequences were used; total n=4 biological replicates/condition per experiment. k,l, qRT-PCR for Met in WT, TNFR1 KO, TNRF2 KO neutrophils upon co-culture with HUVEC/NS or HUVEC/IL (k), or after stimulation with conditioned medium (TCM) from LLC tumours (l). Data are representative of 2 independent experiments using 4 biological replicates/condition per experiment. m, qRT-PCR for MET in human neutrophils stimulated with A549-CCM in presence or absence of Enbrel or human IgG as control. Data are representative of 2 independent experiments using 4 biological replicates/condition per experiment. *, P<0.05 versus Mock (b,c,i), versus TNF-α alone (g), versus HUVEC/NS (j), versus WT (k,l), versus A549-CCM (m); #, P<0.05 versus untreated or HGF alone (f,g), versus HUVEC/NS (k), versus Mock (l,m). Graph shows mean ± s.e.m.
Extended Data Figure 7
Extended Data Figure 7. Met deletion in neutrophils does not affect apoptosis
a,b, Gating strategy of apoptotic WT (a) and Met KO (b) neutrophils in LLC tumours where single cells suspensions were firstly gated for physical parameters and then for CD11b and Ly6G in order to identify neutrophils as double positive cells; this population was finally gated for AnnexinV and 7AAD: AnnexinV+ 7AAD cells display early apoptotic neutrophils whereas AnnexinV+ 7AAD+ cells display late apoptotic neutrophils. c, Quantification of apoptotic WT and Met KO tumour-associated neutrophils measured by FACS. Data combine 2 independent experiments; total n=7 mice/condition. d, Quantification of apoptotic WT and Met KO neutrophils on LLC tumour sections by immunohistochemistry. Data combine 2 independent experiments; total n: WT→WT=7, KO→WT=6. e, FACS analysis for AnnexinV and 7AAD of WT or KO neutrophils incubated for 10 hours in presence or absence of LPS and HGF, alone or in combination. Data combine 2 independent experiments; total n=6 biological replicates/condition. #, P<0.05 versus untreated or HGF alone. Graph shows mean ± s.e.m.
Extended Data Figure 8
Extended Data Figure 8. MET affects neither neutrophil basal migration nor polarization but it is required for neutrophil recruitment and cytotoxicity
a, Quantification of Ly6G staining in ear-sections upon phorbol ester (TPA)-induced cutaneous rash in Mrp8;Metwt/wt and Mrp8;Metlox/lox mice. Data combine 2 independent experiments; total n=8 mice/condition. b, FACS analysis on peritoneal lavages for Ly6G+ neutrophils or F4/80+ macrophages in Mrp8;Metwt/wt and Mrp8;Metlox/lox mice 4 hours after intra-peritoneal injection of sterile zymosan A. Data are representative of 2 independent experiments using 5 mice/condition per experiment. c,d, Quantification of F4/80 (c) and CD3 (d) stainings in ear-sections at baseline and upon TPA-induced cutaneous rash. Data combine 2 independent experiments; total n: WT→WT CTRL=22, KO→WT CTRL=15, WT→WT TPA=23, KO→WT CTRL=15 (c) or total n=8 mice/condition (d). e, FACS quantification of Mrp8;Metwt/wt and Mrp8;Metlox/lox neutrophils recruited into subcutaneous air pouches in response to HGF, CXCL1 or PBS. Data combine 2 independent experiments; total n=6 mice/condition. f, FACS quantification of WT neutrophil adhesion to quiescent HUVEC (HUVEC/NS) or activated HUVEC (HUVEC/IL) in presence or absence of HGF. Data are representative of 2 independent experiments using 4 biological replicates/condition per experiment. g,h, FACS quantification of WT and Met KO neutrophils migrated through a bare porous filter (i.e., in absence of HUVEC) towards HGF (g) or tumour conditioned medium (TCM) (h). Data are representative of 2 independent experiments using 3 biological replicates/condition per experiment. i, Gene expression profile for N1 and N2 markers in neutrophils sorted from LLC tumours grown in WT→WT or KO→WT mice. Data are representative of 3 independent experiments using 4 mice/condition per experiment. j, Cytotoxicity of WT and KO tumour-associated neutrophils against T241 cells in absence or presence of the NO synthase inhibitor L-NMMA. Data are representative of 3 independent experiments using 3 biological replicates/condition per experiment. k, FACS quantification of DAF-FM-positive circulating neutrophils after co-culture with LLC cancer cells as a readout of NO production in absence or presence of HGF. Data are representative of 4 independent experiments using 3 biological replicates/condition per experiment. l, Quantification of LLC cancer cell killing by WT and KO neutrophils (isolated from the blood of tumour-bearing mice), stimulated with HGF alone or in presence of L-NMMA. Data are representative of 2 independent experiments using n=12 biological replicates/condition per experiment. m, Blood neutrophils in WT→WT and KO→WT mice treated with neutrophil-depleting Ly6G antibody or rat IgG as control. Data combine 2 independent experiments; total n=16/condition. *, P<0.05 versus Mrp8;Metwt/wt (a,b), versus Mrp8;Metwt/wt + HGF (e), versus HUVEC/NS (f), versus WT→WT untreated (j), versus WT→WT + HGF (k,l); #, P<0.05 versus CTRL (c,d), versus PBS (e), versus Mock (f,h), versus WT→WT untreated (j-l), versus IgG (m); $, P<0.05 versus WT→WT + HGF (m). All graphs show mean ± s.e.m.
Figure 1
Figure 1. Met deficiency inhibits neutrophil recruitment to tumour and metastatic site
a-g, LLC tumour growth (a), weight (b), lung macrometastases (c), metastatic area (d), representative images of H&E-stained lung sections (e,f), metastatic index (g) in WT→WT and KO→WT chimeras. Data combine 3 independent experiments; total mice: WT→WT=23, KO→WT=26. h-m, Neutrophil quantification and representative images on Ly6G-stained LLC tumour sections (h-j) or on lung sections from tumour-free and tumour-bearing mice (k) represented in (l,m). Data in (h) are representative of 4 independent experiments (6 mice/condition per experiment). Data in (k) combine 3 independent experiments; total mice: Tumour-free=10/condition, Tumour-bearing=15/condition. n-q, LLC tumour growth (n), tumour weight (o), lung macrometastases (p), TAN quantification (q) in WT→WT and KO→WT control chimeras (Mrp8:Empty) or upon neutrophil-specific Met reconstitution (Mrp8:Met). Data combine 2 independent experiments; total mice=10/condition. r-u, LLC tumour growth (r), tumour weight (s), lung macrometastases (t), TAN quantification (u) upon neutrophil-specific Met deletion (Mrp8;Metlox/lox) and controls (Mrp8;Metwt/wt). Data combine 2 independent experiments; total mice=13/condition. *, P<0.05. Scale bars: 100 μm (e,f), 50 μm (i,j,l,m). Graphs show mean ± s.e.m..
Figure 2
Figure 2. Met deficiency in hematopoietic cells fosters progression of several tumour types
a-c, Growth of T241 fibrosarcomas (a), B16F10 melanomas (b), PyMT-driven breast tumours (c). Data in (a,b) combine 2 independent experiments; total mice=14/condition (a), 8/condition (b). Data in (c) combine 3 independent experiments; total mice: WT→PyMT=13, KO→PyMT=16. d-g, Liver weight (d), nodules (e), and images (f,g) after H-RasG12V/c-Myc-driven HCC (n=4 mice/condition). h-j, Quantification (h) on H&E-stained bowel sections (i,j) of AOM/DSS-induced colon adenomas (yellow arrowheads) or carcinomas (red arrowheads). Data combine 2 independent experiments; total mice=10/condition. k, Spontaneous lung metastases from B16F10 tumours or lung colonisation after B16F10 intravenous injection. Data combine 2 independent experiments; total mice=8/condition. l, Lung macrometastases from PyMT tumours. Data combine 3 independent experiments; total mice: WT→PyMT=13, KO→PyMT=16. m, TAN quantification in T241, B16F10, PyMT, HCC, CRC tumour-tissues. Total mice: T241, CRC=10/condition, B16F10=8/condition, combining 2 experiments; WT→PyMT=13, KO→PyMT=16, combining 3 experiments; HCC=4/condition (1 experiment). n,o, B16F10 tumour growth (n), spontaneous metastases and lung colonisation (o) in Mrp8;Metwt/wt and Mrp8;Metlox/lox mice. Data combine 2 independent experiments; total mice: Mrp8;Metwt/wt=12, Mrp8;Metlox/lox=8. p, Liver nodules in Mrp8;Metwt/wt and Mrp8;Metlox/lox HCC-bearing mice. Total mice=7/condition. q, TAN quantification in B16F10 tumours (total mice=8/condition) or HCC (total mice=7/condition). r-t, Tumour growth (r), weight (s) and TANs in Met-silenced (shMet) and scramble B16F10 tumours after PF-04217903 or vehicle treatment. Data combine 2 independent experiments (total mice=11/condition for scramble, 14/condition for shMet). *, P<0.05. Scale bars: 200 μm (i,j), 0.5 cm (f,g). Graphs show mean ± s.e.m..
Figure 3
Figure 3. Met expression in neutrophils is induced by tumour-derived soluble factors
a-b, qRT-PCR (a) and FACS (b) analysis for MET in blood neutrophils from tumour (TM)-free or LLC-tumour-bearing mice and in TANs. c, qRT-PCR for MET in human neutrophils from lung cancer versus healthy tissue. n=4 patients. d,e, MET expression by qRT-PCR (d) and Western blot (e) in circulating neutrophils from tumour-free mice after co-culture with unstimulated (HUVEC/NS) or IL-1α-pre-stimulated (HUVEC/IL) HUVEC, or after stimulation with TCM or CCM. f,g, qRT-PCR (f) or Western blot (g) for MET in circulating human neutrophils after stimulation with A549-CCM. h, Western blot for MET in mouse and human neutrophils after LPS or TNF-α stimulation. i, qRT-PCR for Met in WT, TNFR1 KO or TNFR2 KO neutrophils after TNF-α stimulation. j,k, qRT-PCR (j) and Western blot (k) for MET in mouse neutrophils after TNF-α stimulation with or without NF-κB inhibitor. l, qRT-PCR for Met in mouse neutrophils co-cultured with HUVEC/IL or stimulated with TCM in presence or absence of Enbrel. m,n, FACS for MET in TANs (m) and immunohistochemistry for Ly6G (n) in LLC tumours after Enbrel. Data combine 2 independent experiments; total mice=5/condition. All data in (a,b,d,f,i,j,l) are representative of 2 independent experiments using 4 biological replicates/condition per experiment. All Western blots were repeated 3 times on independent biological replicates. Full Western blot images are shown in Supplementary Figure 1. Loading control in (e,h) displays tubulin or actin according to Supplementary Figure 1. *, P <0.05; #, P <0.05 versus Mock (i,l), versus untreated (j). Graphs show mean ± s.e.m..
Figure 4
Figure 4. MET is required for neutrophil transendothelial migration and cytotoxicity
a-c, Neutrophils quantification (a) on TPA-painted ear skin (b,c). Data combine 2 independent experiments; total mice=10/condition for vehicle, 14/condition for TPA. d, FACS analysis for Ly6G+ neutrophils or F4/80+ macrophages on peritoneal lavages after zymosan-induced peritonitis. Data are representative of 2 independent experiments using 4 mice/condition per experiment. e, FACS analysis for neutrophil recruitment towards HGF or CXCL1 in air pouch assays. Data combine 3 independent experiments; total mice=10/condition. f, Ly6G infiltration in LLC tumours or in TPA-painted ear skin after anti-HGF. Data combine 2 independent experiments; total mice: IgG=11, anti-HGF=6. g-i, Neutrophil adhesion to HUVEC/IL (g) and transendothelial migration in response to HGF (h) or TCM with or without anti-HGF (i). Data in (g-i) are representative of 3 independent experiments using 3 biological replicates/condition per experiment. j,k, qRT-PCR for Nos2 in LLC-tumour-associated neutrophils or macrophages (j) and tumour-derived NO production (k). l-n, Quantification (l) and representative images (m,n) of 3NT and Ly6G-costained LLC tumour sections. Data in (j-n) combine 2 independent experiments; total mice=8/condition. o, TAN cytotoxicity against LLC cells with or without L-NMMA. Data are representative of 4 independent experiments using 3 biological replicates/condition per experiment. p-r, LLC tumour growth (p), weight (q), TANs (r) following neutrophil-depleting anti-Ly6G treatment. Data combine 2 independent experiments; total mice=16/condition. *, P<0.05; #, P<0.05 versus PBS (e), versus Mock (g-i), versus WT→WT untreated (o). Scale bars: 100 μm (b,c), 20 μm (m,n). Graphs show mean ± s.e.m..

References

    1. Gherardi E, Birchmeier W, Birchmeier C, Vande Woude G. Targeting MET in cancer: rationale and progress. Nat Rev Cancer. 2012;12:89–103. - PubMed
    1. Bertotti A, et al. Only a subset of Met-activated pathways are required to sustain oncogene addiction. Sci Signal. 2009;2:er11. - PubMed
    1. Lennerz JK, et al. MET amplification identifies a small and aggressive subgroup of esophagogastric adenocarcinoma with evidence of responsiveness to crizotinib. J Clin Oncol. 2011;29:4803–4810. - PMC - PubMed
    1. Choueiri TK, et al. Phase II and biomarker study of the dual MET/VEGFR2 inhibitor foretinib in patients with papillary renal cell carcinoma. J Clin Oncol. 2013;31:181–186. - PMC - PubMed
    1. Comoglio PM, Giordano S, Trusolino L. Drug development of MET inhibitors: targeting oncogene addiction and expedience. Nat Rev Drug Discov. 2008;7:504–516. - PubMed

Publication types

MeSH terms