. 2015 Jun;125(6):2429-44.
doi: 10.1172/JCI78945. Epub 2015 May 18.

Phosphatidylinositol 3-kinase signaling determines kidney size

Phosphatidylinositol 3-kinase signaling determines kidney size

Jian-Kang Chen et al. J Clin Invest. 2015 Jun.

Abstract

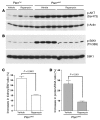
Kidney size adaptively increases as mammals grow and in response to the loss of 1 kidney. It is not clear how kidneys size themselves or if the processes that adapt kidney mass to lean body mass also mediate renal hypertrophy following unilateral nephrectomy (UNX). Here, we demonstrated that mice harboring a proximal tubule-specific deletion of Pten (Pten(ptKO)) have greatly enlarged kidneys as the result of persistent activation of the class I PI3K/mTORC2/AKT pathway and an increase of the antiproliferative signals p21(Cip1/WAF) and p27(Kip1). Administration of rapamycin to Pten(ptKO) mice diminished hypertrophy. Proximal tubule-specific deletion of Egfr in Pten(ptKO) mice also attenuated class I PI3K/mTORC2/AKT signaling and reduced the size of enlarged kidneys. In Pten(ptKO) mice, UNX further increased mTORC1 activation and hypertrophy in the remaining kidney; however, mTORC2-dependent AKT phosphorylation did not increase further in the remaining kidney of Pten(ptKO) mice, nor was it induced in the remaining kidney of WT mice. After UNX, renal blood flow and amino acid delivery to the remaining kidney rose abruptly, followed by increased amino acid content and activation of a class III PI3K/mTORC1/S6K1 pathway. Thus, our findings demonstrate context-dependent roles for EGFR-modulated class I PI3K/mTORC2/AKT signaling in the normal adaptation of kidney size and PTEN-independent, nutrient-dependent class III PI3K/mTORC1/S6K1 signaling in the compensatory enlargement of the remaining kidney following UNX.


Figures
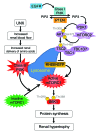
Figure 14
Figure 14. Schematic diagram depicting the regulation of kidney size by PI3K signaling in different contexts.
UNX causes increased RBF and therefore increased renal delivery of free amino acids to the remaining kidney, leading to activation of a PTEN-independent, but class III PI3K–dependent, mTORC1 translocation to the lysosomal membrane where the mTORC1 activator RHEB resides and activates mTORC1 signaling to phosphorylate and activate the downstream effector S6K1. This leads to increased protein synthesis and renal hypertrophy, while the interplay between PTEN and EGFR-dependent class I PI3K/mTORC2/AKT/TSC2/mTORC1/S6K1 signaling mediates appropriate kidney weight/BW ratios.
Figure 13
Figure 13. UNX induces increased RBF and renal delivery of amino acids, activates class III PI3K, and induces mTOR localization on the lysosomal membrane in the remaining kidney.
(A) An immediate increase in RBF in mice occurred upon ligation of the contralateral renal pedicle, followed by gradually decreased RBF initiated by an overdose perfusion of isoflurane. RBF is expressed as blood perfusion units (BPU). (B) Significant increases were observed in free amino acid content in the remaining kidney of mice in response to UNX (U) compared with sham-operated mice (S). ANOVA with Bonferroni’s t correction was used for statistical analysis of the data. *P < 0.001 indicates a comparison between group U versus group S at each time point, respectively. No significant difference was seen in the S group at different time points (P > 0.05). n = 5 mice per group per time point. (C) Class III PI3K kinase activity in the left kidney was measured using the same lipid kinase activity assay as in Figure 11A after 8-week-old male DBA/2 mice were subjected to right sham or UNX surgery for the indicated time periods, with the lower panel showing immunoprecipitated class III PI3K. (D) Eight-week-old male DBA/2 mice were subjected to right sham or UNX surgery. The mice were sacrificed 6 hours later to harvest and process the left kidney for immunofluorescence staining and confocal microscopy to detect the localization of mTOR and LAMP1. n = 5 mice per treatment group for animal experiments with similar results. Scale bar: 5 μm.
Figure 12
Figure 12. Knockdown of class III PI3K activity inhibits mTOR translocation to lysosomal membranes and activation in cultured renal proximal tubule epithelial cells.
(AC) Mouse MCT cells transfected with either scrambled control siRNA or class III PI3K–specific siRNA and made quiescent before treatment with 1× amino acids, 100 nM insulin, or vehicle (saline) alone for 30 minutes. Cell lysates were subjected to immunoblotting (A and B) and class III PI3K activity assays (C, top), along with confirmation of the levels of immunoprecipitated class III PI3K (C, bottom) by immunoblotting following immunoprecipitation with anti–class III PI3K antibodies. (D and E) MCT cells were transfected with scrambled control siRNA (D) or siRNA specific for mouse class III PI3K (E). Cells were made quiescent 48 hours after transfection as detailed in Methods and then restimulated with vehicle control (–AA) or 1× amino acids (+AA) for 10 minutes. Cells were then processed for coimmunofluorescence staining to detect endogenous mTOR (green) and the lysosomal membrane marker LAMP1 (red), along with DAPI to highlight nuclei (blue), and imaged by confocal microscopy. The mTOR and LAMP1 localization pattern was exhibited by 90% to 100% of the cells. Shown are representative images from at least 3 independent cell culture experiments with similar results. Scale bar: 5 μm.
Figure 11
Figure 11. Increased delivery of amino acids increases class III PI3K activity, induces mTOR translocation to lysosomal membranes and activation, and induces hypertrophy in the kidneys of WT mice.
Inbred 8-week-old male DBA/2 mice were injected through the tail vein with either 2× amino acids or vehicle (saline) control as detailed in Methods. Thirty minutes later, the mice were sacrificed and kidney samples harvested to measure class III PI3K activity by immunoprecipitation with anti–class III PI3K antibodies, followed by an in vitro lipid kinase activity assay using PI as a substrate (A, top); an aliquot of the immunoprecipitated proteins (IP) was subjected to immunoblotting (IB) with an anti–class III PI3K antibody to detect the amounts of immunoprecipitated class III PI3K (A, bottom). The remaining harvested kidney samples were used to measure mTORC1 signaling to S6K1 phosphorylation at Thr389 (B), and confocal microscopy was used to detect the localization of mTOR (green) and LAMP1 (red), with nuclei highlighted by DAPI (blue) (C). (D and E) Inbred 8-week-old male DBA/2 mice were given daily fresh 4× amino acids through the drinking water (13.3 ml 150× stock amino acids in 500 ml drinking water) or vehicle control (13.3 ml saline in 500 ml drinking water). Two weeks later, the mice were sacrificed to measure renal protein/DNA (D) and kidney/BW (E) ratios. A 1-tailed, unpaired t test was used for statistical analysis of the data in D and E. n = 5 mice per group. P values are shown in the figures to indicate specific comparisons.
Figure 10
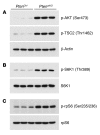
Figure 10. UNX activates mTORC1 signaling but not AKT signaling in the remaining kidney.
Compared with sham operation, UNX had no effect on AKT or TSC2 phosphorylation (A), but markedly increased the phosphorylation levels of both S6K1 (B) and rpS6 (C) in the remaining kidney in either PtenptKO or PtenCtrl mice, respectively. Shown are representative immunoblots for 7 mice per group with similar results.
Figure 9
Figure 9. UNX induces both renal proximal tubular and glomerular enlargement in PtenptKO as well as PtenCtrl mice.
(A and B) UNX-induced hypertrophy occurred not only in the proximal tubules but also in the glomeruli in both PtenCtrl (compare A with Figure 2C) and PtenptKO mice (compare B with Figure 2D). (C and D) Quantification by morphometric analysis of proximal tubule area and glomerular area in sham-operated or UNX-operated PtenCtrl and PtenptKO mice revealed that, unlike the renal growth in sham-operated PtenptKO mice, which did not differ from that seen in the naive PtenptKO mice that only exhibited enlargement of the proximal tubules but not of the glomeruli (also revealed in Figure 2, C–F), UNX-induced compensatory hypertrophy occurred not only in the proximal tubules but also in the glomeruli of both PtenCtrl and PtenptKO mice (C and D). Shown in A and B are representative images from 8-week-old PtenCtrl and PtenptKO mice 4 days after right UNX. ANOVA with Bonferroni’s t correction was used for statistical analysis of the data in C and D. n = 7 mice per group with similar results. P values are shown in the figures to indicate specific comparisons between groups. Scale bars: 50 μm.
Figure 8
Figure 8. UNX induces equivalent levels of compensatory renal hypertrophy in PtenptKO and PtenCtrl mice.
Compared with sham-operated PtenptKO mice and PtenCtrl mice, UNX stimulated equivalent levels of renal hypertrophy in PtenptKO and PtenCtrl mice, respectively, as indicated by the increases in kidney size (A), kidney/BW ratio (B), absolute value of protein/DNA ratio (C), and comparable increases in protein/DNA ratio (D) of the remaining kidney. Image in A shows representative left kidneys from 8-week-old PtenptKO mice and their PtenCtrl littermates 4 days after sham surgery or UNX. ANOVA with Bonferroni’s t correction was used for statistical analysis of the data in BD. n = 5–8 mice per group with similar results. P values are indicated in the respective figures.
Figure 7
Figure 7. Simultaneous deletion of proximal tubule EGFR decreases the renal hypertrophy and AKT/mTOR signaling seen in PtenptKO mice.
(A) Schematic diagram depicting the generation of Egfr and Pten double-KO mice with the Egfrfl/fl Ptenfl/fl phenotype (abbreviated as Egfr PtenptDKO). Deletion of both Pten and Egfr was confirmed by PCR and immunoblot analysis (data not shown). (B) The increased kidney/BW ratio in PtenptKO mice was partially inhibited in Egfr PtenptDKO mice. ANOVA with Bonferroni’s t correction was used for statistical analysis of the data. The indicated P values were calculated from 6 to 10 mice per group. (C and D) The increased levels of AKT (C) and S6K1 (D) seen in the kidneys of PtenptKO mice were both partially inhibited in Egfr PtenptDKO mice. Shown are representative immunoblots for 6 to 10 mice per group with similar results. There were no differences in kidney/BW ratio among the 3 control mice: EgfrCtrl (Egfrfl/fl), PtenCtrl (Ptenfl/fl), and double-control Egfr PtenDCtrl (Egfrfl/fl Ptenfl/fl).
Figure 6
Figure 6. Rapamycin inhibits mTORC1 signaling and renal growth in PtenptKO mice.
Ten-week-old PtenptKO mice were treated with vehicle alone or rapamycin via daily i.p. injection (1 mg/kg BW) for 7 days. Rapamycin treatment had no effect on AKT phosphorylation (A) but inhibited S6K1 phosphorylation (B). Rapamycin also significantly attenuated the increases in kidney/BW (C) and protein/DNA (D) ratios in PtenptKO mice. A 1-tailed, unpaired t test was used for statistical analysis of the data in C and D. n = 5 mice per group. P values are indicated in the respective figures.
Figure 5
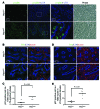
Figure 5. Renal proximal tubule–specific Pten KO increases rpS6 phosphorylation and p21- or p27-positive cells in LTA-positive renal proximal tubules.
(A) Localization of increased rpS6 phosphorylation in PtenptKO kidneys. Kidney sections were stained with an antibody against S235/236-phosphorylated rpS6 (p-rpS6) and the renal proximal tubule marker LTA. Representative images at ×100 original magnification (left 2 panels) indicating increased p-rpS6 (green) in PtenptKO kidneys (left 2 lower panels) compared with PtenCtrl kidneys (left 2 top panels). Images at ×400 original magnification (third panels, top and bottom rows), along with their respective phase-contrast images (fourth panels, top and bottom rows), confirmed the localization of increased p-rpS6 staining in the cytoplasm of renal proximal tubules (with LTA staining on the brush-border membranes). (BE) PtenptKO renal proximal tubule cells exhibited increased protein expression of the cell cycle inhibitors p21Cip1/WAF and p27Kip1. Triple immunofluorescence staining revealed significant increases in both p21Cip1/WAF-positive (B and C) and p27Kip1-positive(D and E) cells in the LTA-positive renal proximal tubule cells from PtenptKO mice compared with those from PtenCtrl mice, respectively. Shown are representative images from 5 individual mice per genotype group with similar results. For quantitation of p21Cip1/WAF-positive (C) and p27Kip1-positive (E) cells per 1,000 nuclei in LTA-positive tubules, Mann-Whitney U tests were used for statistical analysis of the data, with the indicated P values from 5 mice per group. Scale bars: 40 μm (left 2 panels of A) and 10 μm (right 2 panels of A, B, and D).
Figure 4
Figure 4. Renal proximal tubular cell–specific Pten deletion activates the AKT/TSC2/mTORC1 signaling pathway.
PtenCtrl and PtenptKO mice were sacrificed at 9 weeks of age, and their kidney lysates were subjected to immunoblot analysis with the indicated phospho-specific antibodies (AC, top and middle panels), followed by stripping and reprobing of the same blot in each subset of AC with an antibody against β-actin (A, bottom) or against the corresponding total proteins (B and C, bottom) to ensure equal loading. Each lane represents 1 sample from the left kidney of an individual mouse. Shown are representative blots for 5 mice per genotype group with similar results.
Figure 3
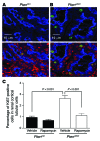
Figure 3. Pten deletion in renal proximal tubules stimulates slight but statistically significant cell proliferation.
(A and B) Representative images of immunofluorescence staining for Ki67 (green), a marker of cell proliferation, in the LTA-positive proximal tubules (blue) in kidney sections from PtenCtrl mice (A) and PtenptKO mice (B), with DAPI staining of nuclei (red). (C) Compared with vehicle treatment, rapamycin treatment significantly inhibited the increased cell proliferation seen in PtenptKO mice. Six images were randomly taken of the cortical tubule area in PtenCtrl or PtenptKO mice (original magnification, ×200) for the quantification of proliferating cells. Values are presented as the ratio of Ki67-positive tubular nuclei (highlighted in green in B by Ki67 staining) to the total nuclei number (highlighted in red in A and B by DAPI staining) in renal proximal tubules (highlighted in blue in A and B by LTA staining). ANOVA with Bonferroni’s t correction was used for statistical analysis of the data in C. n = 4–6 mice per group. P values are indicated in the respective figures. Scale bars: 10 μm.
Figure 2
Figure 2. Pten deletion in renal proximal tubules induces renal hypertrophy.
Renal proximal tubular cell–specific Pten deletion increased the kidney/BW (A) and protein/DNA (B) ratios in the kidney. Renal histology revealed that, compared with their PtenCtrl littermates (C), PtenptKO mice (D) showed hypertrophy in renal proximal tubules but not in glomeruli. Morphometric analysis of the cross-sectional tubule areas and glomerular areas confirmed hypertrophic renal growth exclusively in the proximal tubules (E) but not in the glomeruli (F) of PtenptKO mice. Images in C and D are representative of PtenCtrl and PtenptKO mice at 8 weeks and 4 days of age. A 1-tailed, unpaired t test was used for statistical analysis of the data in A and B; Mann-Whitney U tests were used for statistical analysis of the data in E and F. n = 7 mice per group with similar results. P values are indicated in the respective figures. Scale bars: 50 μm.
Figure 1
Figure 1. Characterization of PtenptKO mice.
(AC) Generation of renal proximal tubular cell–specific Pten-KO (PtenptKO) mice. (A) Schematic depicting the generation of PtenptKO mice. Gender-matched Ptenfl/fl littermates were used as controls (PtenCtrl). (B) PCR verification using the primer pairs 5A and P3 (their relative positions are indicated in A and their sequences listed in Methods), with whole-kidney genomic DNA as templates. The 2200-bp band from the WT allele was readily apparent in PtenCtrl mice but only faintly detected in PtenptKO mice. The 280-bp band was detected only in PtenptKO mice but not in control mice. (C) The Cre recombinase gene was detected by PCR as a 410-bp band in PtenptKO mice but not in PtenCtrl mice, with genomic DNA from ear-punch biopsy samples used as templates. (D) Immunofluorescence staining of kidney sections confirmed that the Ggt1-Cre–mediated Pten deletion occurred selectively in the LTA-positive area (blue) but not in the THP- or DBA-positive tubules (red) of PtenptKO mice, while PTEN (green) was ubiquitously expressed in the kidneys of PtenCtrl mice. Scale bars: 100 μm.

Comment in

References

    1. Tomashefsky P, Tannenbaum M. Macromolecular metabolism in renal compensatory hypertrophy. I. Protein synthesis. Lab Invest. 1969;21(4):358–364. - PubMed
    1. Harris RC, Neilson EG. Toward a unified theory of renal progression. Annu Rev Med. 2006;57:365–380. doi: 10.1146/annurev.med.57.121304.131342. - DOI - PubMed
    1. Silber S, Malvin RL. Compensatory and obligatory renal growth in rats. Am J Physiol. 1974;226(1):114–117. - PubMed
    1. Goss RJ. Effects of maternal nephrectomy on foetal kidneys. Nature. 1963;198:1108–1109. doi: 10.1038/1981108a0. - DOI - PubMed
    1. Li J, et al. PTEN, a putative protein tyrosine phosphatase gene mutated in human brain, breast, and prostate cancer. Science. 1997;275(5308):1943–1947. doi: 10.1126/science.275.5308.1943. - DOI - PubMed

Publication types

MeSH terms

Substances