. 2015 Jun;125(6):2413-28.
doi: 10.1172/JCI78448. Epub 2015 May 18.

Dysfunctional SEMA3E signaling underlies gonadotropin-releasing hormone neuron deficiency in Kallmann syndrome

Dysfunctional SEMA3E signaling underlies gonadotropin-releasing hormone neuron deficiency in Kallmann syndrome

Anna Cariboni et al. J Clin Invest. 2015 Jun.

Abstract

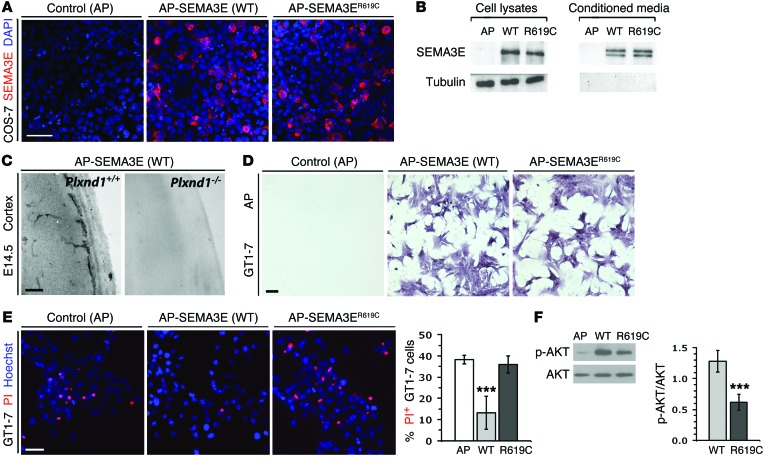
Individuals with an inherited deficiency in gonadotropin-releasing hormone (GnRH) have impaired sexual reproduction. Previous genetic linkage studies and sequencing of plausible gene candidates have identified mutations associated with inherited GnRH deficiency, but the small number of affected families and limited success in validating candidates have impeded genetic diagnoses for most patients. Using a combination of exome sequencing and computational modeling, we have identified a shared point mutation in semaphorin 3E (SEMA3E) in 2 brothers with Kallmann syndrome (KS), which causes inherited GnRH deficiency. Recombinant wild-type SEMA3E protected maturing GnRH neurons from cell death by triggering a plexin D1-dependent (PLXND1-dependent) activation of PI3K-mediated survival signaling. In contrast, recombinant SEMA3E carrying the KS-associated mutation did not protect GnRH neurons from death. In murine models, lack of either SEMA3E or PLXND1 increased apoptosis of GnRH neurons in the developing brain, reducing innervation of the adult median eminence by GnRH-positive neurites. GnRH neuron deficiency in male mice was accompanied by impaired testes growth, a characteristic feature of KS. Together, these results identify SEMA3E as an essential gene for GnRH neuron development, uncover a neurotrophic function for SEMA3E in the developing brain, and elucidate SEMA3E/PLXND1/PI3K signaling as a mechanism that prevents GnRH neuron deficiency.


Figures

Figure 10
Figure 10. Genetic interaction of SEMA3E and CHD7 in KS.
(A) Pedigree of the 2 brothers affected by KS. A heterozygous p.F1019C mutation in CHD7 is present in the brothers with the p.R619C mutation in SEMA3E. Circle denotes female; square denotes male; black square denotes affected male; arrows indicate the probands. (B) Identification of the CHD7 mutation. Sequence chromatograms revealed a heterozygous nucleotide substitution (T>G, asterisks) in exon 12 of CHD7. (C) The CHD7 mutation affects an evolutionarily conserved amino acid residue. Alignment of partial protein sequences of CHD7 orthologs shows that F1019 (red) is evolutionarily conserved. (D) CHD7 domain structure. The position of the mutation is indicated. CD, chromodomain; DEXDc, dead-like helicase domain with ATP-binding pocket; SANT, histone interaction domain; BRK, Brahma and Kismet domain. (E and F) Genetic interaction of Chd7 and Plxnd1. Coronal sections of hypothalamus from adult littermate mice of the indicated genotypes, immunostained to identify GnRH-positive axons at the ME (E), and the quantitation of GnRH pixel intensity in the immunostained sections (F), show more severely reduced ME innervation in compound compared with single mutants. n = 3 each; *P < 0.05 and ***P < 0.001 by 1-way ANOVA. The testes size (E) was correspondingly reduced. Scale bars: 25 μm (ME in E), 400 μm (testes in E).
Figure 9
Figure 9. SEMA3E deficiency reduces GnRH neuron numbers, projection to the ME, and testes size.
(A) SEMA3E in the MPOA. Adjacent coronal sections of E14.5 mouse MPOA, immunolabeled for GnRH and PLXND1 or SEMA3E; the SEMA3A single channel is shown adjacent to the triple label. Arrowheads indicate examples of PLXND1- and GnRH-positive neurons stained for SEMA3E, consistent with SEMA3E binding to PLXND1. (BD) SEMA3E loss reduced GnRH neuron numbers. (B) Coronal sections of E14.5 MPOA were immunolabeled to identify GnRH neurons; Δ denotes neuron deficiency in mutants compared with controls; arrowheads indicate examples of GnRH neurons with a normal, elongated morphology; black arrows indicate rounded GnRH neurons in the mutants. (C) Quantitation revealed a significant reduction in GnRH neuron numbers in Sema3e mutants compared with WT littermates. n = 3; **P < 0.01 by Student’s t test. (D) Quantitation revealed a significant reduction of GnRH neuron numbers in Sema3e mutant relative to WT forebrain, but normal numbers in the nose. n = 3; **P < 0.01 by Student’s t test. (E) Loss of SEMA3E or neural PLXND1 reduced GnRH neuron projections to the ME. Coronal sections of adult hypothalamus were immunostained to identify GnRH-positive axons (green) projecting to the ME (counterstained with DAPI, blue); innervation was poor in mutants compared with that in WT (indicated by Δ). (F) Loss of SEMA3E or neural PLXND1 reduced testes size. Testes pairs from adult littermate males were photographed side by side to demonstrate the reduced size of testes in SEMA3E-null and neuron-specific PLXND1 mutants. Scale bars: 25 μm (A); 50 μm (B); 50 μm (E); 300 μm (F).
Figure 8
Figure 8. KDR deficiency decreases GnRH neuron numbers in the brain.
(A) GnRH neurons expressed KDR in the brain. Coronal sections of E17.5 mouse MPOA of the indicated genotypes were immunolabeled for GnRH and KDR.Higher-magnification images of the areas indicated by dotted boxes and corresponding single channels for KDR are shown adjacent to each panel. White arrowheads indicate examples of GnRH-positive cells; red arrowheads indicate KDR staining in the same cells in the single-channel images. Clear red arrowheads indicate GnRH-positive cells with KDR knockdown. Small white and red arrows indicate KDR-positive blood vessels. (B and C) Reduced number of GnRH neurons in the brain of mice lacking KDR in neurons. Coronal sections of E17.5 mouse MPOA from the indicated genotypes were immunolabeled for GnRH (B) and the number of GnRH neurons quantitated (C) (n = 3 each; **P < 0.01, Student’s t test). Scale bars: 150 μm and 50 μm (low- and high-magnification images in A, respectively), 50 μm (B).
Figure 7
Figure 7. Reduced GnRH neuron numbers and increased apoptosis correlate in the Plxnd1-null MPOA.
(A and B) PLXND1 loss caused GnRH neuron loss after the forebrain. Sagittal sections of E14.5 mouse heads were immunolabeled for GnRH, revealing fewer GnRH neurons in mutant compared with WT heads (A). Dotted lines indicate the boundary between the nose and forebrain. White dotted squares indicate regions shown at higher magnification in the adjacent panels. (B) Quantitation of GnRH neuron distribution shows that GnRH neuron loss was only significant in the mutant forebrain, but not the nose (n = 3 each; **P < 0.01, Student’s t test). (C and D) PLXND1 loss caused GnRH neuron loss in the MPOA. (C) Coronal sections of E17.5 MPOA were immunolabeled for GnRH, revealing fewer GnRH neurons in the mutant mice than in the WT mice. (D) Quantitation confirmed a significant reduction of GnRH neuron numbers in PLXND1-deficient compared with WT MPOA (n = 3 each; **P < 0.01, Student’s t test). (E and F) PLXND1 loss increased apoptosis in the MPOA. (E) Adjacent coronal sections of E14.5 MPOA were immunolabeled for GnRH together with PLXND1 or activated caspase-3, revealing apoptotic cells in areas containing GnRH neurons (indicated with solid arrowheads). Higher-magnification images of areas indicated with dotted squares are shown in the adjacent panels. (F) Quantitation shows increased cell death in the MPOA of Plxnd1-null versus WT mice (n = 3 each; **P < 0.01, Student’s t test). (G) PLXND1 loss caused GnRH neuron apoptosis. Gnrh ISH of coronal sections from E14.5 MPOA followed by immunolabeling for activated caspase-3 revealed apoptotic GnRH neurons (indicated with solid arrowheads). Scale bars: 150 μm (A and E), 50 μm (C and higher-magnification images of boxed areas in E), 45 μm (G).
Figure 6
Figure 6. PLXND1 is dispensable for axonal and vascular patterning in the embryonic mouse nose.
(A) PLXND1 expression in E12.5 mouse nose. Sagittal sections of E12.5 WT heads, immunolabeled for PLXND1 and the OLF/VN axonal marker peripherin (top panels) or the vascular marker IB4 (bottom panels); sections were counterstained with DAPI. Higher-magnification images of the areas indicated with dotted squares are shown in the adjacent panels. The clear arrow indicates a PLXND1-positive axon and the solid arrow a PLXND1-positive blood vessel. (B) PLXND1 expression in E14.5 mouse nose and brain. Coronal sections of E14.5 WT nose (top panels) and MPOA (bottom panels), immunolabeled for PLXND1 and peripherin; sections were counterstained with DAPI. Higher-magnification images of the areas indicated by dotted boxes are shown in the adjacent panels. PLXND1 expression in axons in the nose and OLF bulbs (OB) is indicated with arrowheads. Note PLXND1 expression by GnRH neurons in the MPOA (clear arrow), but not by the caudal branch of the VN nerve (clear arrowhead). 3v, third ventricle. (C and D) Normal nasal axon and nasal/brain blood vessel patterning in Plxnd1-null mutants. Coronal sections of E14.5 mouse heads of the indicated genotypes at the level of the nose (top panels) and MPOA (bottom panels) were immunolabeled for peripherin and counterstained with DAPI (C) or labeled with the blood vessel marker IB4 (D). Dotted lines indicate forebrain boundaries. Scale bars: 150 μm (AD), 50 μm (higher-magnification images of boxed areas in A and B).
Figure 5
Figure 5. PLXND1 is expressed during GnRH neuron migration in the mouse.
(A) Schematic representation of an embryonic mouse head to illustrate the migration of GnRH neurons (green dots) from the olfactory (OE) and VNO epithelia (blue) along OLF and VN axons (purple) through the nasal compartment (NC) into the forebrain (FB). (BH) Sagittal and coronal sections of mouse heads at the indicated developmental stages, immunolabeled for GnRH and PLXND1; nuclei were counterstained with DAPI. Higher-magnification images of the areas indicated with dotted squares in B are shown in panels C and D, and for E and G in F and H, respectively. Adjacent to each panel in BH, the corresponding single channels for PLXND1 are shown in grayscale. In C, clear arrows indicate PLXND1-positive, GnRH-negative cells, and clear arrowheads indicate examples of GnRH-positive, PLXND1-negative cells in the OE. Solid arrows in D indicate GnRH neurons with low levels of PLXND1 in association with OLF axons with high levels of PLXND1. In F, clear arrowheads indicate PLXND1-negative GnRH neurons (their position is indicated with an asterisk). In H, PLXND1-positive GnRH neurons in the MPOA and their neurites are indicated with straight and wavy arrows, respectively. Scale bars: 150 μm (B, E, and G); 50 μm (C, D, and F); 25 μm (H).
Figure 4
Figure 4. The SEMA3ER619C mutation fails to rescue GT1-7 neuron survival.
(A and B) Generation of WT and mutant SEMA3E AP fusion proteins. COS-7 cells were transfected with a control expression vector or vectors encoding AP fused to human SEMA3E or mutant SEMA3ER619C. Cells were immunolabeled (A) or immunoblotted (B) with an antibody against SEMA3E. Cells and conditioned media contained a band of approximately 180 kDa, composed of the 95-kDa hSEMA3E and 85-kDa AP fragments. Tubulin was used as a loading control. (C) AP-SEMA3E bound WT, but not Plxnd1-null, tissue. Sagittal sections of E14.5 mouse cerebral cortex of the indicated genotypes were incubated with AP-SEMA3E. Note that SEMA3E bound blood vessels in WT, but not in Plxnd1-null, tissue. (D) AP-SEMA3E binding to GnRH neurons in vitro. The incubation of GT1-7 cells with COS cell–conditioned DMEM containing AP ligands demonstrated similar binding of WT AP-SEMA3E and mutant AP-SEMA3ER619C to GT1-7 cells, while AP alone did not bind the cells. (E) SEMA3ER619C was not neuroprotective for GT1-7 cells. PI and Hoechst staining shows that WT SEMA3E, but not SEMA3ER619C, mediated neuroprotection of serum-starved GT1-7 cells. The percentage of PI-positive cells relative to Hoechst-stained cells is shown as the mean ± SEM. n = 3; ***P < 0.001 by 1-way ANOVA. (F) The SEMA3ER619C mutation impaired PI3K-dependent AKT phosphorylation. Immunoblotting and graph quantitation show AKT (Ser473) phosphorylation relative to total AKT in serum-starved GT1-7 cells treated for 15 minutes with WT SEMA3E or SEMA3ER619C. n = 3; ***P < 0.001 by Student’s t test. Scale bars: 50 μm (A), 150 μm (C), 20 μm (D), 100 μm (E).
Figure 3
Figure 3. KDR is important for SEMA3E-induced GnRH neuron survival in vitro.
(A) Expression of KDR in GT1-7 cells. RT-PCR analysis revealed expression of Plxnd1 in GN11 cells and, at higher levels, in GT1-7 cells, while Kdr was detectably expressed only in GT1-7 cells; Gapdh served as a loading control. (BD) Loss of KDR function impaired the SEMA3E-mediated neuroprotection of GT1-7 cells. Quantification of cell death in serum-starved GT1-7 cultures, expressed as a percentage of PI-positive cells in all cells, which were identified by Hoechst staining (B; n = 3; **P < 0.01 by 1-way ANOVA), and representative examples of stained cultures treated with control IgG in the absence of neurotrophic factors (C) or in the presence of FBS or SEMA3E with control IgG or αKDR (D). Scale bar: 25 μm in C.
Figure 2
Figure 2. SEMA3E promotes GnRH neuron survival via PLXND1 and PI3 kinase activation.
(A and B) SEMA3E protects GT1-7 but not GN11 cells from death induced by serum starvation. Serum-starved GN11 (top row) and GT1-7 (bottom row) cells were treated with serum or SEMA3E. Dying cells were visualized by PI staining in the presence of Hoechst nuclear counterstain (A) to determine the proportion of PI-positive cells relative to all Hoechst-stained cells, shown as the mean ± SEM; n = 3; **P < 0.01 and ***P < 0.001 by 1-way ANOVA (B). (C and D) Blocking PLXND1 abolished SEMA3E-mediated neuroprotection of GT1-7 cells. Immunofluorescence staining with PLXND1 antibody (αPLXND1) showed that GT1-7 cells expressed PLXND1 (left panel, C). PI and Hoechst staining showed that αPLXND1, but not control IgG, inhibited SEMA3E-mediated neuroprotection in GT1-7 cells (right 2 panels, C). Proportion of PI-positive cells in all Hoechst-stained cells (D), shown as the mean ± SEM; n = 3; **P < 0.01 by 1-way ANOVA. (E and F) Blocking PI3K abolished SEMA3E-mediated neuroprotection of GT1-7 cells. PI and Hoechst staining showed that LY294 did not affect cell death under control conditions (left 2 panels, E), but inhibited SEMA3E-mediated neuroprotection in GT1-7 cells (right 2 panels, E). Proportion of PI-positive cells in all Hoechst-stained cells (F), shown as the mean ± SEM. n = 3; **P < 0.001 by 1-way ANOVA. (G and H) SEMA3E promoted PI3K-dependent AKT phosphorylation in GT1-7 neurons. Immunoblotting shows increased levels of phosphorylated AKT (p-AKT) (Ser473) relative to total AKT in serum-starved GT1-7 cells treated with SEMA3E, and LY294 abolished SEMA3E-induced AKT phosphorylation. n = 3; **P < 0.01 by Student’s t test. Scale bars: 10 μm (left panel, C); 25 μm (all other panels). The red line in H indicates the p-AKT/AKT ratio in untreated serum-starved GT1-7 cells, which was set to 1.
Figure 1
Figure 1. Exome sequencing identifies a SEMA3E point mutation in KS patients.
(A) Pedigree of brothers affected by KS carrying a novel SEMA3E mutation. Circle denotes female; square denotes male; black square denotes affected male; arrows indicate the probands. (B) Sequence chromatograms of nucleotides 1849–1863 of the SEMA3E coding sequence in 2 brothers carrying a nucleotide substitution in exon 16 (left side, forward strand; right side, reverse strand; the positions of the C>T and corresponding G>A change are indicated with asterisks). (C) Diagram of the SEMA3E functional domains: SEMA, PSI (plexin/semaphorin/integrin), Ig (Ig-like, C2-type), and basic domains; their position and the position of the mutated amino acid residue within the protein sequence are indicated. (D) Alignment of partial protein sequences of vertebrate SEMA3E orthologs shows that the R619 residue is evolutionarily conserved in mammals (red), but not in chick or zebrafish (green). (E) Genomic evolutionary rate profiling of sequence constraint for the SEMA3E mutation in the 2 KS brothers using GERP++ analysis provided an RS score of 5.54, which is close to the maximum score of 6.18 for complete conservation across all mammalian species. (F) Computational models of a dimer of the Ig domain of WT and mutant SEMA3E. The model is based on the Robetta algorithm for comparative protein structure prediction. The highest-scoring dimer model is shown. The R619 residue and the R619C substitution are indicated by white arrowheads. (G) Schematic drawing illustrating the protein interaction between SEMA3E and PLXND1, including its structural domains — the SEMA and PSI domains, similar to those of SEMA3E — as well as the IPT (Ig-like, plexin, transcription factor) domains and the serine/threonine protein kinase catalytic domains 1 and 2 (SP1 and SP2).

Comment in

Similar articles

Cited by

References

    1. Wierman ME, Kiseljak-Vassiliades K, Tobet S. Gonadotropin-releasing hormone (GnRH) neuron migration: initiation, maintenance and cessation as critical steps to ensure normal reproductive function. Front Neuroendocrinol. 2011;32(1):43–52. doi: 10.1016/j.yfrne.2010.07.005. - DOI - PMC - PubMed
    1. Sykiotis GP, Pitteloud N, Seminara SB, Kaiser UB, Crowley WF., Jr Deciphering genetic disease in the genomic era: the model of GnRH deficiency. Sci Transl Med. 2010;2(32):32rv2. - PMC - PubMed
    1. Schwanzel-Fukuda M, Bick D, Pfaff DW. Luteinizing hormone-releasing hormone (LHRH)-expressing cells do not migrate normally in an inherited hypogonadal (Kallmann) syndrome. Brain Res Mol Brain Res. 1989;6(4):311–326. doi: 10.1016/0169-328X(89)90076-4. - DOI - PubMed
    1. Wray S. From nose to brain: development of gonadotrophin-releasing hormone-1 neurones. J Neuroendocrinol. 2010;22(7):743–753. doi: 10.1111/j.1365-2826.2010.02034.x. - DOI - PMC - PubMed
    1. Cariboni A, Davidson K, Rakic S, Maggi R, Parnavelas JG, Ruhrberg C. Defective gonadotropin-releasing hormone neuron migration in mice lacking SEMA3A signalling through NRP1 and NRP2: implications for the aetiology of hypogonadotropic hypogonadism. Hum Mol Genet. 2011;20(2):336–344. doi: 10.1093/hmg/ddq468. - DOI - PubMed

Publication types

MeSH terms