. 2015 Sep;29(9):3638-53.
doi: 10.1096/fj.14-261289. Epub 2015 May 18.

Sphingosine 1-phosphate is a ligand for peroxisome proliferator-activated receptor-γ that regulates neoangiogenesis

Affiliations

Sphingosine 1-phosphate is a ligand for peroxisome proliferator-activated receptor-γ that regulates neoangiogenesis

Kate A Parham et al. FASEB J. 2015 Sep.

Abstract

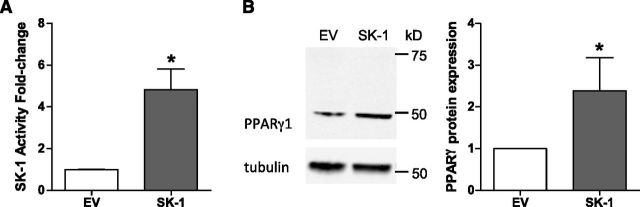
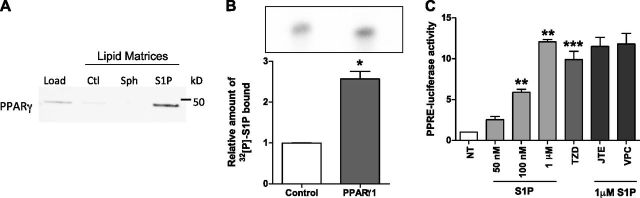
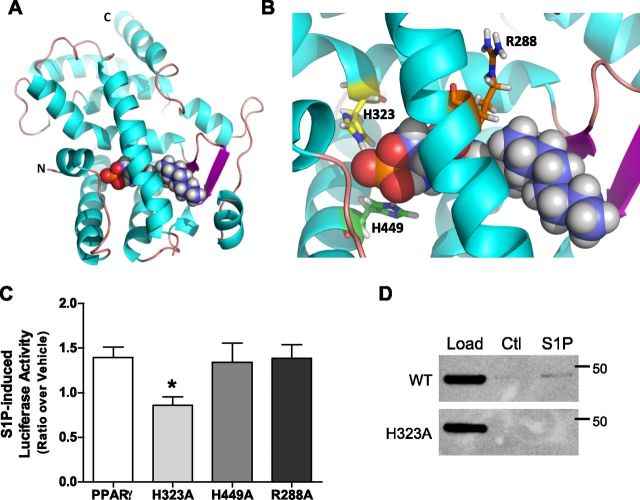
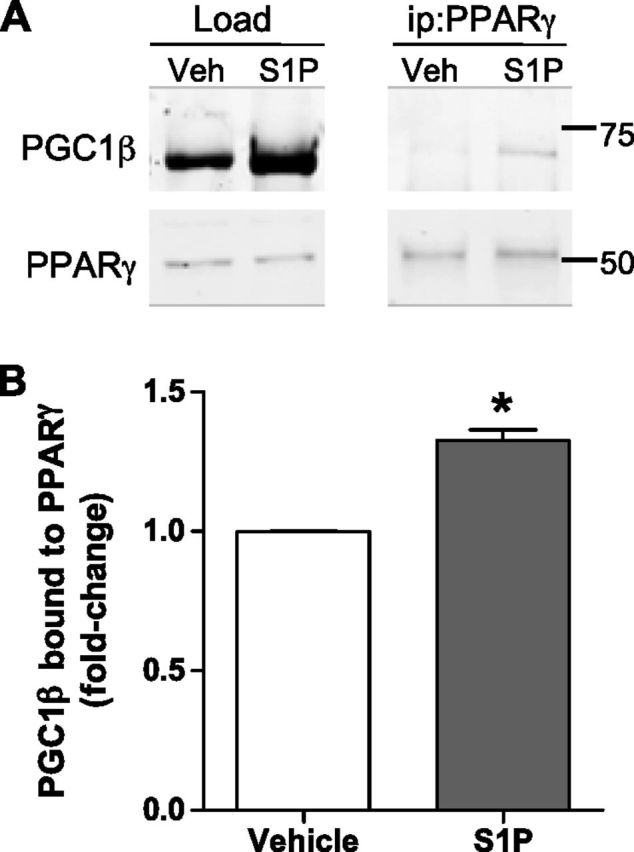
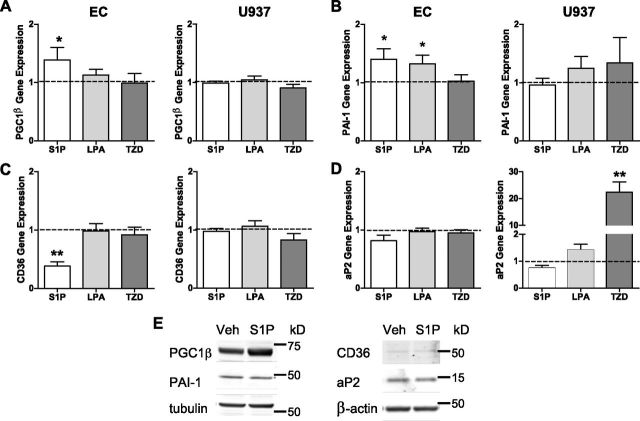
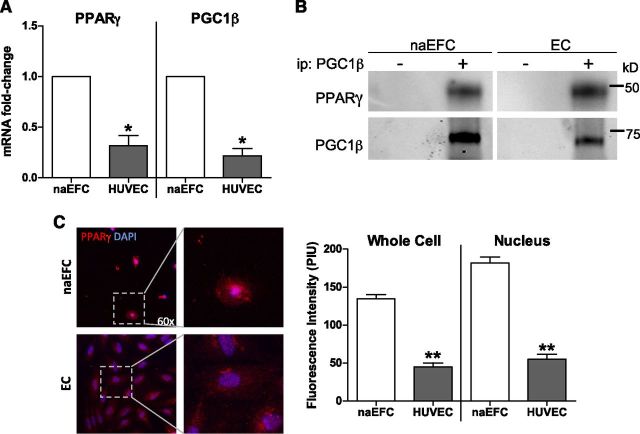
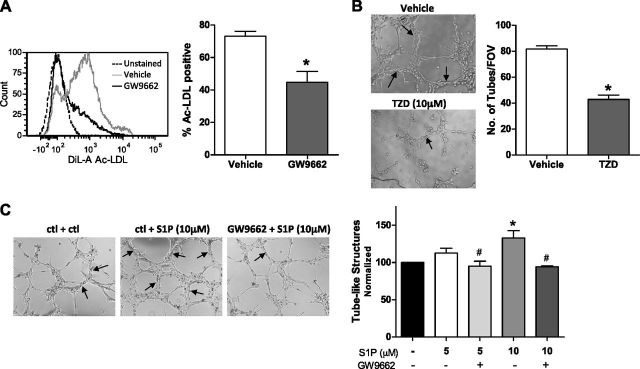
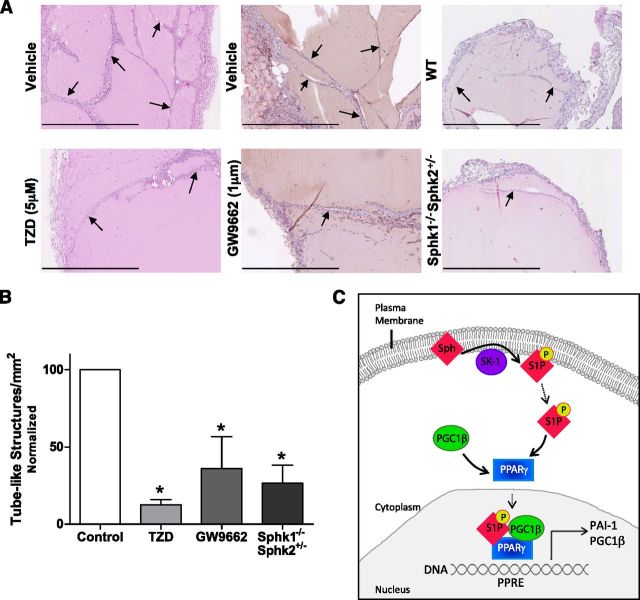
Sphingosine 1-phosphate (S1P) is a bioactive lipid that can function both extracellularly and intracellularly to mediate a variety of cellular processes. Using lipid affinity matrices and a radiolabeled lipid binding assay, we reveal that S1P directly interacts with the transcription factor peroxisome proliferator-activated receptor (PPAR)γ. Herein, we show that S1P treatment of human endothelial cells (ECs) activated a luciferase-tagged PPARγ-specific gene reporter by ∼12-fold, independent of the S1P receptors. More specifically, in silico docking, gene reporter, and binding assays revealed that His323 of the PPARγ ligand binding domain is important for binding to S1P. PPARγ functions when associated with coregulatory proteins, and herein we identify that peroxisome proliferator-activated receptor-γ coactivator 1 (PGC1)β binds to PPARγ in ECs and their progenitors (nonadherent endothelial forming cells) and that the formation of this PPARγ:PGC1β complex is increased in response to S1P. ECs treated with S1P selectively regulated known PPARγ target genes with PGC1β and plasminogen-activated inhibitor-1 being increased, no change to adipocyte fatty acid binding protein 2 and suppression of CD36. S1P-induced in vitro tube formation was significantly attenuated in the presence of the PPARγ antagonist GW9662, and in vivo application of GW9662 also reduced vascular development in Matrigel plugs. Interestingly, activation of PPARγ by the synthetic ligand troglitazone also reduced tube formation in vitro and in vivo. To support this, Sphk1(-/-)Sphk2(+/-) mice, with low circulating S1P levels, demonstrated a similar reduction in vascular development. Taken together, our data reveal that the transcription factor, PPARγ, is a bona fide intracellular target for S1P and thus suggest that the S1P:PPARγ:PGC1β complex may be a useful target to manipulate neovascularization.

Keywords: endothelial; neovascularization; transcription factor.


Conflict of interest statement

The authors thank Dr. David Dimasi for preparing the ECs, Samantha Escarbe for preparing the nonadherent endothelial forming cells, Lorena Davies for technical assistance with sphingosine 1-phosphate analysis, Dr. James Fells for his assistance with the in silico docking experiments, Dr. Melissa Pitman for assistance with interpretation of the in silico docking data, and the staff and consenting donors at Women’s and Children’s Hospital (North Adelaide, Adelaide, SA, Australia) and Burnside Memorial Hospital (Burnside, Adelaide, SA, Australia) for the donation and collection of the umbilical cords and UCB. This work and C.S.B. were supported by a Heart Foundation Fellowship (CR 10A 4983). K.A.P. was supported by an Australian Postgraduate Award and the Co-operative Research Centre for Biomarker Translation. S.M.P. was supported by a Senior Research Fellowship (1042589) from the National Health and Medical Research Council of Australia and the Fay Fuller Foundation. The authors declare no conflicts of interest.

Figures

Figure 1.
Figure 1.
Overexpression of SK-1 in ECs increases PPARγ protein expression. A) SK-1 activity of ECs transduced with SK-1 was determined by the enzymatic SK-1 assay. Data are expressed as normalized SK-1 fold changes + sem (n = 3). B) Expression of PPARγ protein in SK-1-transduced ECs was visualized by immunoblotting. Quantified data are expressed as normalized mean band intensities ± sem (n = 3). *P < 0.05.
Figure 2.
Figure 2.
S1P is a ligand for PPARγ. A) His-tagged human recombinant PPARγ (Load) was incubated with control (Ctl), sphingosine (Sph), and S1P affinity matrices. Bound PPARγ was resolved by SDS-PAGE and immunoblotting with an anti-His antibody. Representative blot from n = 3. B) Relative amount of [32P]S1P bound to Flag-PPARγ1 was quantified by [32P]S1P spot intensity. Data are expressed as means + sem (n = 3). *P < 0.05. C) Human ECs transfected with PPRE-Luc were treated with S1P at 50 nM, 100 nM, and 1 μM or the TZD (troglitazone) at 1 μM; or 1 µM S1P with 10 µM JTE013 (JTE; mean from n = 2 plus range) or 1 µM VPC23019 (VPC; mean from n = 2 plus range) for 5 h. Results are fold activation relative to Renilla controls. Data are expressed as means + sem (n = 3). **P < 0.005 and ***P < 0.01 compared to no treatment (NT).
Figure 3.
Figure 3.
S1P interacts with the PPARγ ligand binding pocket via His323. A) Computational modeling was utilized to predict the interaction between S1P and the PPARγ LBD (PDB entry 3R5N). S1P is represented in the LBD as spheres colored by atom type (C is in purple, H is in gray, P is in orange, and O is in red) within residues 207–474 of the PPARγ LBD (ribbon structure: α-helices are cyan; and β-sheets are magenta). B) Magnification of the PPARγ binding pocket reveals predicted interacting residues His323 (orange; H323) and His449 (green; H449). Arg288 (orange; R288) is not predicted to interact with S1P. C) Validation of the predicted interacting residues was determined via luciferase assay using WT PPARγ and alanine substitution mutants of the predicted residues (H323A, H449A, and R288A) following 5 µM S1P for 5 h. Luciferase activity was normalized to Renilla controls. Data are represented as mean ratios of luciferase activity of vehicle to S1P + 5 µM sem (n = 3). *P < 0.005 compared to PPARγ WT. D) S1P binding to PPARγ1(H323A) was assessed using cell lysates from HEK293T cells over-expressing PPARγ1 WT or PPARγ1(H323A) in a lipid affinity matrix binding assay. Bound PPARγ was resolved by SDS-PAGE and immunoblotting with an anti-Flag antibody. Representative blot from n = 3.
Figure 4.
Figure 4.
S1P induces PGC1β to bind to PPARγ in ECs. PPARγ and PGC1β association in response to S1P was determined by PPARγ immunoprecipitation of EC lysates treated with 5 μM S1P (20 h). A) Representative blot and (B) PGC1β protein from PPARγ immunoprecipitation (ip) normalized to PGC1β load are shown. Veh, vehicle. Data are expressed as PGC1β band intensity fold changes + sem (n = 3). *P < 0.05.
Figure 5.
Figure 5.
Treatment of ECs and U937 cells with PPARγ results in differential gene expression. Expression of (A) PGC1β, (B) PAI-1, (C) CD36, and (D) aP2 in ECs and U937 cells in response to 16-h treatment with 5 μM S1P, 5 μM LPA, and 5 μM rosiglitazone (TZD) was determined by qPCR. Gene expression was normalized to CYCA. Data are expressed as mean relative fold changes + sem with vehicle (depicted as dotted line) (n = 6). *P < 0.05 and **P < 0.001 determined by unpaired t test compared to vehicle. E) Protein expression in ECs in response to 5 µM S1P for 16 h was determined using SDS-PAGE and immunoblotting. Representative blot from n = 3.
Figure 6.
Figure 6.
PPARγ and PGC1β are expressed and associate in naEFCs and ECs. A) Endogenous PPARγ and PGC1β gene expression was determined in naEFCs and ECs by qPCR. Gene expression was normalized to CYCA. Data are expressed as means + sem (n = 3). *P < 0.001. B) An interaction between PGC1β and PPARγ was determined by PGC1β immunoprecipitation from naEFC and EC protein lysates. Bound PPARγ and confirmation of PGC1β pull down were detected via immunoblotting compared to no antibody control. Representative blot from n = 3. C) PPARγ protein in naEFCs and ECs was assessed by immunofluorescence and confocal microscopy. Cells were immunostained for PPARγ (Alexa Fluor 594 in red) and the nucleus (DAPI in blue). PPARγ protein intensity was quantified using pixel intensity units (PIU). Images were taken at ×60 for publication, with single cells magnified to show PPARγ localization. Data are expressed as mean PIU + sem (n = 3). **P < 0.05.
Figure 7.
Figure 7.
PPARγ regulates DiI-Ac-LDL uptake and in vitro vessel-like structure formation. A) naEFCs were treated with the PPARγ antagonist, GW9662, at 5 μM for 20 h prior to incubation with DiI-Ac-LDL. Uptake was detected by flow cytometry. Representative histogram from n = 3. Data are expressed as means + sem (n = 3). *P < 0.05. B) Human ECs were treated with the PPARγ agonist, troglitazone (TZD), at 10 μM and vehicle (DMSO) for 20 h prior to Matrigel tube formation assay. Data are expressed as mean tubes per well [field of view (FOV)] + sem (n = 3). C) Human ECs were pretreated with GW9662 (1 µM) or vehicle for 30 min before being stimulated with S1P (5 or 10 µM) or vehicle. The number of tubes formed after 6 h was quantified, per well. Data are expressed as means + sem (n = 4). *P < 0.05 vs. vehicle and #P < 0.05 vs. respective S1P alone.
Figure 8.
Figure 8.
PPARγ regulates vessel-like structure formation in vivo. Matrigel plugs containing (A) 1 μM GW9662 and vehicle (DMSO), (B) 5 µM TZD and vehicle (DMSO), or from WT and Sphk1−/−Sphk2+/− mice were retrieved and H&E stained. The number of newly formed tube-like structures was counted per square millimeter. Arrows depict examples of quantified tube-like structures. Scale bars, 800 μm. Data are expressed as percentages of control per square millimeter + sem (n = 3–7). *P < 0.05 vs. vehicle or WT. C) Schematic representation of the formation of the PPARγ transcriptional complex in ECs. Plasma membrane sphingosine is phosphorylated by SK-1, producing the bioactive lipid, S1P. Free S1P in the cytoplasm binds to the PPARγ complex, stimulating the recruitment of PGC1β and translocation of this transcriptional complex into the nucleus. The PPARγ:S1P:PGC1β complex binds to PPREs in the gene promoter and facilitates transcription of the PPARγ target genes: PGC1β and PAI-1.

References

    1. Pitson S. M. (2011) Regulation of sphingosine kinase and sphingolipid signaling. Trends Biochem. Sci. , 97–107 - PubMed
    1. Yatomi Y., Igarashi Y., Yang L., Hisano N., Qi R., Asazuma N., Satoh K., Ozaki Y., Kume S. (1997) Sphingosine 1-phosphate, a bioactive sphingolipid abundantly stored in platelets, is a normal constituent of human plasma and serum. J. Biochem. , 969–973 - PubMed
    1. García-Pacios M., Collado M. I., Busto J. V., Sot J., Alonso A., Arrondo J. L., Goñi F. M. (2009) Sphingosine-1-phosphate as an amphipathic metabolite: its properties in aqueous and membrane environments. Biophys. J. , 1398–1407 - PMC - PubMed
    1. Hla T., Venkataraman K., Michaud J. (2008) The vascular S1P gradient-cellular sources and biological significance. Biochim. Biophys. Acta , 477–482 - PMC - PubMed
    1. Lin C. I., Chen C. N., Lin P. W., Lee H. (2007) Sphingosine 1-phosphate regulates inflammation-related genes in human endothelial cells through S1P1 and S1P3. Biochem. Biophys. Res. Commun. , 895–901 - PubMed

Publication types

MeSH terms

Substances

LinkOut - more resources