. 2015 May 20:14:55.
doi: 10.1186/s12933-015-0222-3.

Sex influenced association of directly measured insulin sensitivity and serum transaminase levels: Why alanine aminotransferase only predicts cardiovascular risk in men?

Affiliations

Sex influenced association of directly measured insulin sensitivity and serum transaminase levels: Why alanine aminotransferase only predicts cardiovascular risk in men?

Barbara Buday et al. Cardiovasc Diabetol. .

Abstract

Background: Non alcoholic fatty liver disease (NAFLD) is an independent cardiovascular (CV) risk factor which is closely associated with insulin resistance measured by both direct or indirect methods. Gender specific findings in the relationship between alanine aminotransferase (ALT) and CV disease, the prevalence of NAFLD and type 2 diabetes (T2DM) have been published recently. The aim of the present study was to explore the gender aspects of the association between insulin sensitivity, liver markers and other metabolic biomarkers in order to elucidate the background behind the sex influenced difference in both NAFLD, T2DM and their association with CV risk.

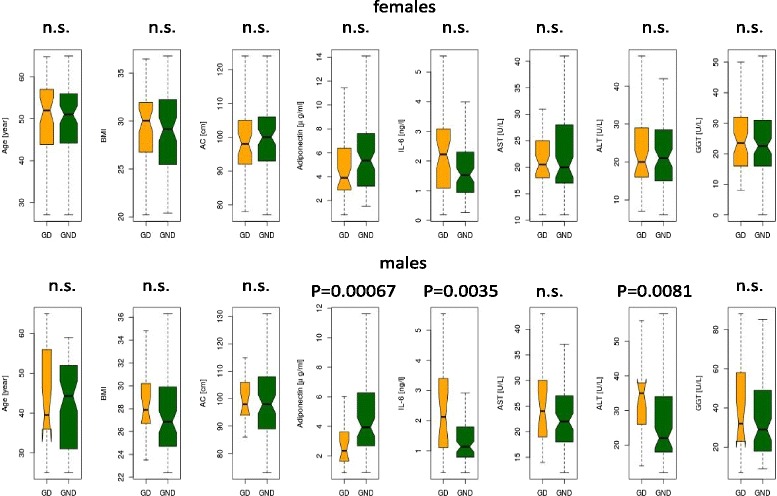
Patients and methods: 158 female (47 normal and 111 impaired glucose intolerant) and 148 male (74 normal and 74 impaired glucose tolerant) subjects were included (mean age: 46.5 ± 8.31 vs. 41.6 ± 11.3, average Hba1c < 6.1 %, i.e. prediabetic population, drug naive at the time of the study). Subjects underwent a hyperinsulinemic normoglycemic clamp to determine muscle glucose uptake (M3), besides liver function tests and other fasting metabolic and anthropometric parameters were determined.

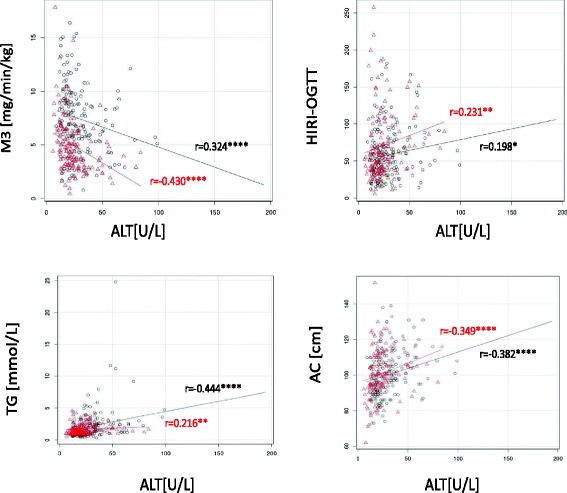
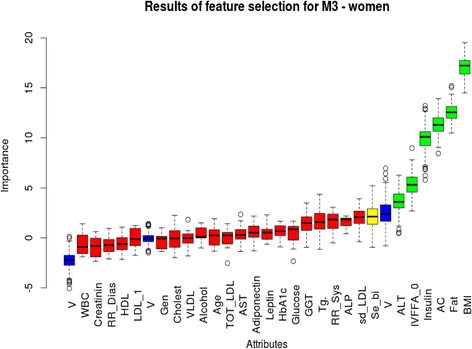
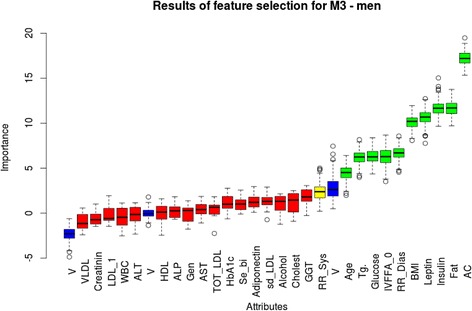
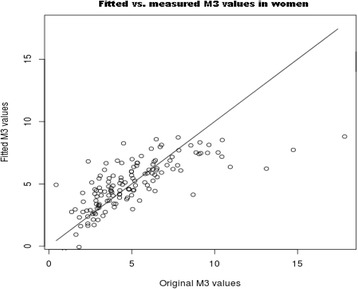
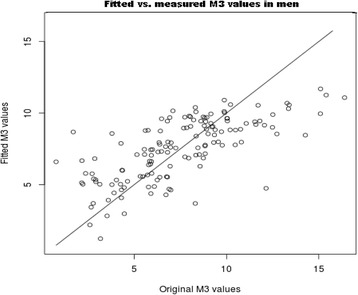
Results: Significant bivariate correlations were found between clamp measured M3 and all three liver enzymes (ALT, aspartate aminotransferase and gamma-glutamyl transferase) in both sexes. When data were adjusted for possible metabolic confounding factors correlations ceased in the male population but stayed significant in the female group. Feature selection analysis showed that ALT is an important attribute for M3 in the female but not in male group (mean Z: 3.85 vs. 0.107). Multiple regression analysis confirmed that BMI (p < 0.0001) and ALT (p = 0.00991) significantly and independently predicted clamp measured muscle glucose uptake in women (R(2) = 0.5259), while in men serum fasting insulin (p = 0.0210) and leptin levels (p = 0.0294) but none of the liver enzymes were confirmed as significant independent predictors of M3 (R(2) = 0.4989).

Conclusion: There is a gender specific association between insulin sensitivity, metabolic risk factors and liver transaminase levels. This might explain the sex difference in the predictive role of ALT elevation for CV disease. Moreover, ALT may be used as a simple diagnostic tool to identify insulin resistant subjects only in the female population according to our results.


Figures

Fig. 1
Fig. 1
Boxplot diagrams for comparison of metabolic parameters and liver enzymes, in age and BMI matched GD and GND males and females. Homogenous subpopulations were formed for group comparisons between GD and GND groups with Wilcoxon test (GD males n = 26, GND males n = 60, GD females n = 58, GND males n = 91). No significant differences were measured between age, BMI, abdominal circumference between GD and GND groups. Moreover body fat percentage, insulin sensitivity (M3), OGTT-glucose, estradiol, testosterone and FSH levels did not differ significantly between groups (data not shown). Even small or moderate alcohol consumption was excluded. In age and BMI matched GD males ALT, adiponectin and IL-6 values were significantly higher than in GND males. Further significant differences were found in HDL-C in males. In females no significant difference was noted, except for IL-6, which was border significant (p = 0.063)
Fig. 2
Fig. 2
Scatter plots for bivariate correlations between liver enzymes and component of metabolic syndrome. Scatter plots in men (black spots) and women (red spots) representing bivariate (Spearman) correlations between HIRI, M3, basal glucose, TG, AC and liver enzymes (ALT, AST, GGT). Correlation coefficients are indicated in black (men), and in red (women). Correction done for BMI, age, HBA1c, genetic disposition and alcohol consumption. Significance level of each correlation is further indicated *: p < 0.05, **: p < 0.01, ***: p < 0.001, ****: p < 0.0001
Fig. 3
Fig. 3
Feature selection (Boruta algorithm) analysis for M3 in women. Important attributes are marked in green: BMI, fat percentage, abdominal circumference, insulin, basal FFA (IVFFA_0) and ALT (mean Z: 18.46, 12.04, 9.34, 5.76 and 3.85, respectively). Yellow and red columns represent attributes that were rejected or ‘tentative’ as being important for M3: these are (in order of importance): serum-bilirubin, small-dense LDL, alkaline phosphatase, systolic blood pressure, triglyceride, GGT, fasting glucose, HbA1c, leptin, adipoectin, AST, total-LDL-cholesterol, age, alcohol consumption, VLDL, total-cholesterol, genetic predisposition, LDL-1 subclass, HDL subclass, diastolic blood pressure, creatinin, white blood cell count. Mean, median, minimum and maximum Z values are represented on ‘Y’ axis
Fig. 4
Fig. 4
Feature selection (Boruta algorithm) analysis for M3 in men. Important attributes are marked in green: abdominal circumference, insulin, body fat percentage, leptin, BMI, diastolic blood pressure, TG, basal FFA, serum glucose and age (mean Z values: 16.65, 13.08, 12.19, 11.77, 6.12, 6.00, 5.39, 4.92 and 4.11, respectively). Yellow and red columns represent attributes that were rejected or ‘tentative’ as being important for M3. These are (in order of importance): systolic blood pressure, GGT, total cholesterol, alcohol consumption, small-dense LDL %, adiponectin, serum-bilirubin, HbA1c, total-LDL %, AST, genetic predisposition, alkaline phosphatase, HDL %, ALT, white blood cell count, LDL-1 %, creatinin, VLDL %. Blue columns represent ‘shadow attributes’. Mean, median, minimum and maximum Z values are represented on ‘Y’ axis
Fig. 5
Fig. 5
Linear regression for original vs. fitted M3 values in women estimated by multiple regression analysis for attributes determined by Feature Selection: BMI (p = 1.9e-05), AC (p = 0.39377), serum-insulin (p = 0.09028), serum-FFA (p = 0.07899), ALAT (p = 0.00991). Multiple R-squared: 0.5259, Adjusted R-squared: 0.5084
Fig. 6
Fig. 6
Linear regression for original vs. fitted M3 values in men estimated by multiple regression analysis for attributes determined by FS: AC (p = 0.2813), leptin (p = 0.0294), BMI (p = 0.4253), serum-insulin (p = 0.0210), triglyceride (p = 0.5699), serum-FFA (p = 0.2364), serum-glucose (p = 0.1067), diastolic RR (p = 0.6340), age (p = 0.0516). Multiple R-squared: 0.4989, Adjusted R-squared: 0.465

References

    1. Sattar N. Gender aspects in type 2 diabetes mellitus and cardiovascular risk. Best Pract Res Clin Endocrinol Metab. 2013;27:501–7. doi: 10.1016/j.beem.2013.05.006. - DOI - PubMed
    1. Lazo M, Hernaez R, Eberhardt MS, Bonekamp S, Kamel I, Guallar E, et al. Prevalence of nonalcoholic fatty liver disease in the United States: the third National health and nutrition examination Survey, 1988–1994. Am J Epidemiol. 2013;178:38–45. doi: 10.1093/aje/kws448. - DOI - PMC - PubMed
    1. Logue J, Walker JJ, Colhoun HM, Leese GP, Lindsay RS, McKnight JA, et al. Scottish diabetes research network epidemiology group. Do men develop type 2 diabetes at lower body mass indices than women? Diabetologia. 2011;54:3003–6. doi: 10.1007/s00125-011-2313-3. - DOI - PMC - PubMed
    1. Feitosa MF, Reiner AP, Wojczynski MK, Graff M, North KE, Carr JJ, et al. Sex-influenced association of nonalcoholic fatty liver disease with coronary heart disease. Atherosclerosis. 2013;227:420–4. doi: 10.1016/j.atherosclerosis.2013.01.013. - DOI - PMC - PubMed
    1. Wannamethee SG, Papacosta O, Lawlor DA, Whincup PH, Lowe GD, Ebrahim S, et al. Do women exhibit greater differences in established and novel risk factors between diabetes and non-diabetes than men? The British Regional Heart Study and British Women’s Health Study. Diabetologia. 2012;55:80–7. doi: 10.1007/s00125-011-2284-4. - DOI - PubMed

Publication types

MeSH terms