. 2015 Aug 1;197(15):2517-35.
doi: 10.1128/JB.00176-15. Epub 2015 May 18.

Environmental Sensing in Actinobacteria: a Comprehensive Survey on the Signaling Capacity of This Phylum

Affiliations

Environmental Sensing in Actinobacteria: a Comprehensive Survey on the Signaling Capacity of This Phylum

Xiaoluo Huang et al. J Bacteriol. .

Abstract

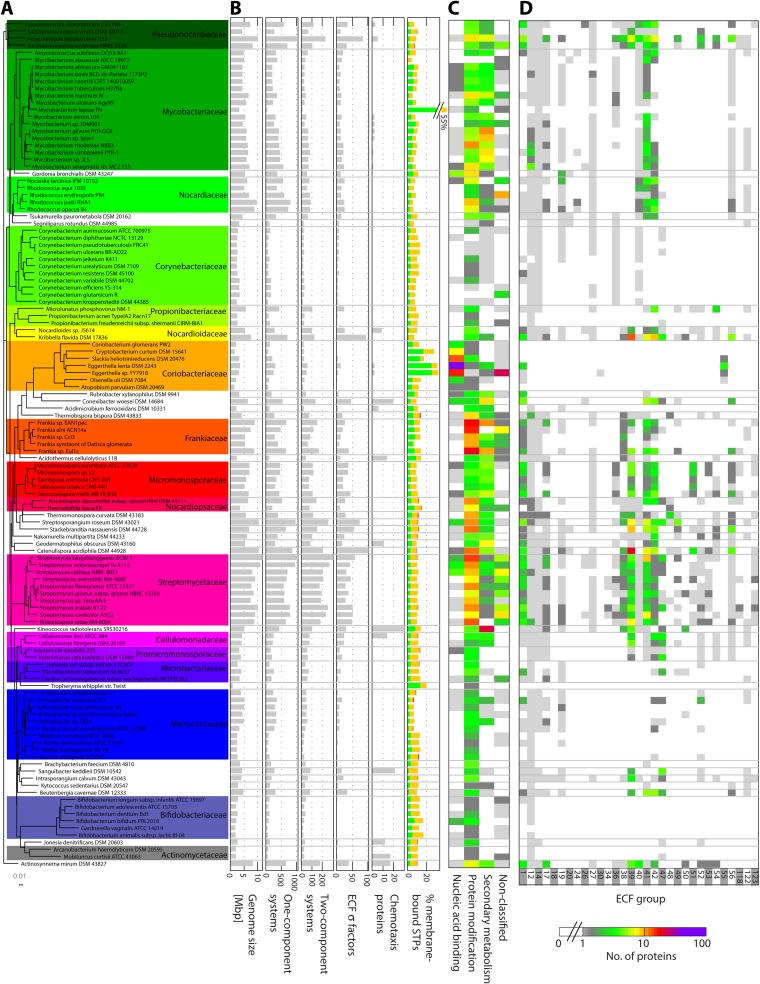
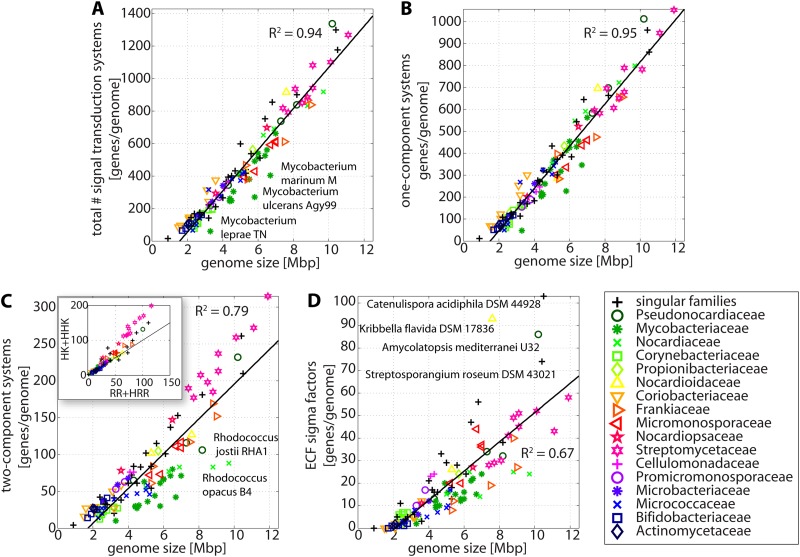
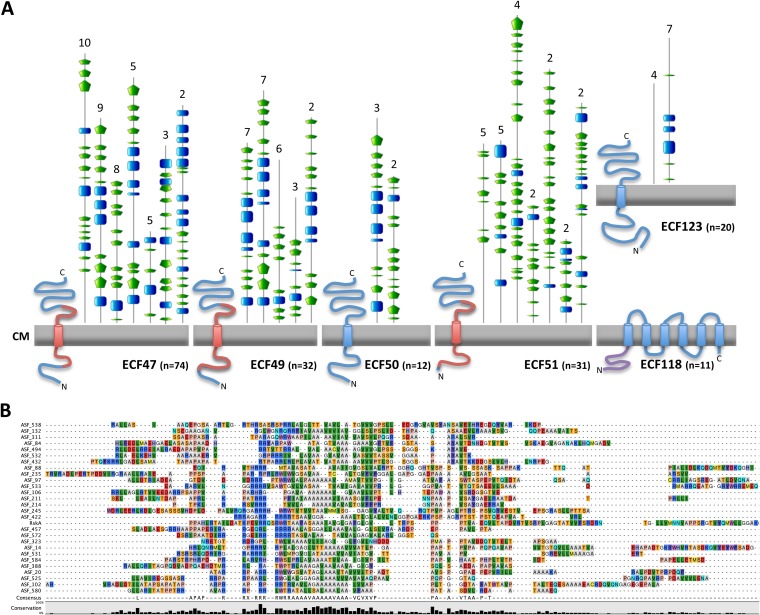
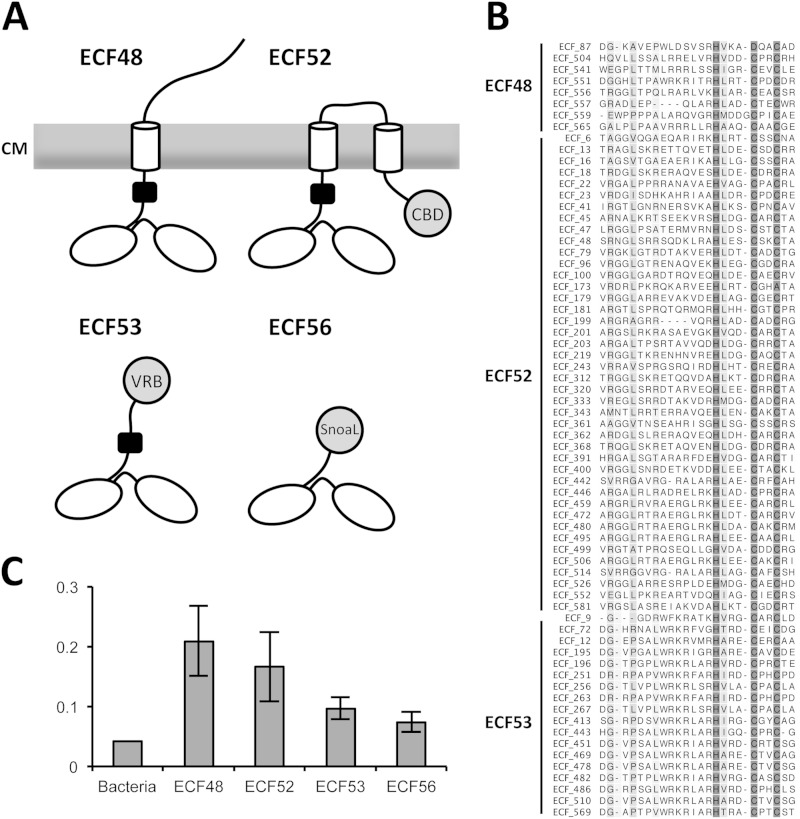
Signal transduction is an essential process that allows bacteria to sense their complex and ever-changing environment and adapt accordingly. Three distinct major types of signal-transducing proteins (STPs) can be distinguished: one-component systems (1CSs), two-component systems (2CSs), and extracytoplasmic-function σ factors (ECFs). Since Actinobacteria are particularly rich in STPs, we comprehensively investigated the abundance and diversity of STPs encoded in 119 actinobacterial genomes, based on the data stored in the Microbial Signal Transduction (MiST) database. Overall, we observed an approximately linear correlation between the genome size and the total number of encoded STPs. About half of all membrane-anchored 1CSs are protein kinases. For both 1CSs and 2CSs, a detailed analysis of the domain architectures identified novel proteins that are found only in actinobacterial genomes. Many actinobacterial genomes are particularly enriched for ECFs. As a result of this study, almost 500 previously unclassified ECFs could be classified into 18 new ECF groups. This comprehensive survey demonstrates that actinobacterial genomes encode previously unknown STPs, which may represent new mechanisms of signal transduction and regulation. This information not only expands our knowledge of the diversity of bacterial signal transduction but also provides clear and testable hypotheses about their mechanisms, which can serve as starting points for experimental studies.

Importance: In the wake of the genomic era, with its enormous increase in the amount of available sequence information, the challenge has now shifted toward making sense and use of this treasure chest. Such analyses are a prerequisite to provide meaningful information that can help guide subsequent experimental efforts, such as mechanistic studies on novel signaling strategies. This work provides a comprehensive analysis of signal transduction proteins from 119 actinobacterial genomes. We identify, classify, and describe numerous novel and conserved signaling devices. Hence, our work serves as an important resource for any researcher interested in signal transduction of this important bacterial phylum, which contains organisms of ecological, biotechnological, and medical relevance.


Figures

FIG 1
FIG 1
Distribution pattern of STPs in the phylum Actinobacteria. (A) Phylogenetic tree (based on 16S rRNA) of all the organisms analyzed here. The names of the families represented in our collection by more than one genome are shown on the right in a larger font. Each family is color coded. (B) Distributions of genome sizes and each type of STP by organism. For the percentage of membrane-bound STPs, the color codes for the type of STP is as follows: 1CSs, green; 2CSs, orange; and ECFs, red. (C) The distribution of 1CSs is illustrated by a two-dimensional heat map, where the colors indicate the number of 1CSs of a given type in a given genome. (D) The distribution of ECFs into groups is also illustrated by a two-dimensional heat map, where the colors indicate ECF numbers. The color code is the same as for panel C and is shown below. For clarity, only ECF groups containing more than 10 proteins are shown.
FIG 2
FIG 2
Correlation of STP numbers with genome sizes. Shown are scatter plots of the total numbers of STPs (A), 1CSs (B), 2CSs (C), and ECFs (D) encoded in a given genome as a function of the organism's genome size. The inset in panel C shows the correlation between HKs and RRs. In all cases, the total numbers of proteins are represented, and the genomes are color coded by taxonomical family. The black lines represent the best fit of a linear equation, and the points that deviate the most from that line are identified by the organism's name. In all panels, the size of the symbol is proportional to the organism's genome size.
FIG 3
FIG 3
(A to C) Schematic representations of domain architectures of 1CSs (A), HKs (B), and RRs (C) that are found only in Actinobacteria. Cytoplasmic membranes (CM) are represented in gray, and TMHs are shown as cylinders. HK domains responsible for dimerization and phosphoacceptance are represented as squares, while ATPase domains are represented as hexagons. RR domains are represented as triangles. Other domains are represented by circles with their Pfam designations. (D) Relevant genomic context conservation. An ASF-coding gene is represented by the obliquely hatched arrow, while genes encoding anti-anti-sigma factors are represented by vertically hatched arrows. CoA, coenzyme A; DHG, dehydrogenase; PG GT, peptidoglycan glycosyltransferase; PT, CDP-diacylglycerol-3-phosphate 3-phosphatidyltransferase; UF, unknown function. The remaining acronyms represent Pfam domains for which a description can be found in Table S10 in the supplemental material.
FIG 4
FIG 4
Classification of actinobacterial ECFs. (A) Distribution of actinobacterial ECFs into old and newly defined groups. The proportions of ECFs now classified into groups containing fewer than 10 proteins (white) and those that remain unclassified (brown) are also represented. (B) Phylogenetic tree of previously unclassified ECFs and those of groups ECF118, ECF122, and ECF123 created from a gapless multiple-sequence alignment of regions σ2 and σ4. Shading following the same color code as for panel A highlights each branch that represents a new group. (C) Putative ways in which the activities of ECFs of each group are regulated. (D) Genomic conservation in ECF groups. Genes encoding ECFs are represented in black, putative ASFs by diagonal hatching, and a putative anti-anti-σ factor by vertical hatching. ABC, ABC transporter; CBP, calcium-binding protein; MAP, membrane-associated protein; MT, methyltransferase; RG, transcriptional regulator; SRT, sortase; UF, unknown function. Only groups containing more than 10 proteins are represented. See the text for details.
FIG 5
FIG 5
Putative ASFs. (A) Schematic representation of the architecture of the putative ASFs. Cytoplasmic membranes (CM) are represented in gray, and predicted transmembrane helices as cylinders. The secondary structures of the predicted periplasmic regions are shown above. The blue squares represent helices, and the green pentagons represent strands. The numbers at the top are the numbers of proteins showing that secondary structure. RskA domains are colored red, and ZAS domains are colored purple. The total number of ECFs in each group is given in parentheses. For clarity, only groups containing more than 10 proteins are represented. (B) Multiple-sequence alignment of ASFs containing RskA domains. The sequences are identified by the ASF numbers (see Table S7 in the supplemental material), and the degree of sequence conservation is represented in a bar graph at the bottom. Amino acid residues are colored with RasMol colors, and gaps are represented by dashes.
FIG 6
FIG 6
ECFs containing C-terminal extensions. (A) Schematic representation of the architecture of ECFs containing C-terminal extensions. The σ2 and σ4 regions are represented as ovals; the ZAS domain is represented as a black box, TMHs are shown as cylinders, and other domains are shown as circles. CBD, carbohydrate-binding domain; CM, cytoplasmic membrane; Snoal, SnoaL_2 domain; VRB, variable domain. (B) Multiple-sequence alignment of the ZAS domain (PF13490) identified in members of the groups ECF48, ECF52, and ECF53. The degree of sequence conservation is color coded from white (no conservation) to dark gray (full conservation), clearly revealing the HXXXCXXC motif putatively responsible for zinc binding. (C) Proline frequency in bacteria (average) and in the C-terminal extensions of ECFs of groups ECF48, ECF52, ECF53, and ECF56. The error bars denote standard deviations.
FIG 7
FIG 7
Putative ECF target promoters. Shown are sequence logos illustrating the −35 and −10 motifs, as well as the corresponding spacer sequences. The exact motifs identified by BioProspector are underlined beneath each logo. The bar charts represent the distributions of spacer lengths found in the identified promoters and the distance between the most upstream residue of the −35 motif and the start codon. The categories are as follows: −50, distances between 0 and −50; −100, distances between −51 and −100; −150, distances between −101 and −150; −200, distances between −151 and −200; −250, distances between −201 and −250. Target promoters were predicted only for groups containing more than 10 proteins and whose putative target promoter motifs were not identified previously.

References

    1. Ulrich LE, Koonin EV, Zhulin IB. 2005. One-component systems dominate signal transduction in prokaryotes. Trends Microbiol 13:52–56. doi:10.1016/j.tim.2004.12.006. - DOI - PMC - PubMed
    1. Galperin MY. 2006. Structural classification of bacterial response regulators: diversity of output domains and domain combinations. J Bacteriol 188:4169–4182. doi:10.1128/JB.01887-05. - DOI - PMC - PubMed
    1. Helmann JD, Chamberlin MJ. 1988. Structure and function of bacterial sigma factors. Annu Rev Biochem 57:839–872. doi:10.1146/annurev.bi.57.070188.004203. - DOI - PubMed
    1. Mascher T. 2013. Signaling diversity and evolution of extracytoplasmic function (ECF) σ factors. Curr Opin Microbiol 16:148–155. doi:10.1016/j.mib.2013.02.001. - DOI - PubMed
    1. Mascher T, Helmann JD, Unden G. 2006. Stimulus perception in bacterial signal-transducing histidine kinases. Microbiol Mol Biol Rev 70:910–938. doi:10.1128/MMBR.00020-06. - DOI - PMC - PubMed

Publication types

MeSH terms

Substances