. 2015 Jun 10;6(16):14191-208.
doi: 10.18632/oncotarget.3691.

EFEMP1 promotes the migration and invasion of osteosarcoma via MMP-2 with induction by AEG-1 via NF-κB signaling pathway

Affiliations

EFEMP1 promotes the migration and invasion of osteosarcoma via MMP-2 with induction by AEG-1 via NF-κB signaling pathway

Zhuo Wang et al. Oncotarget. .

Abstract

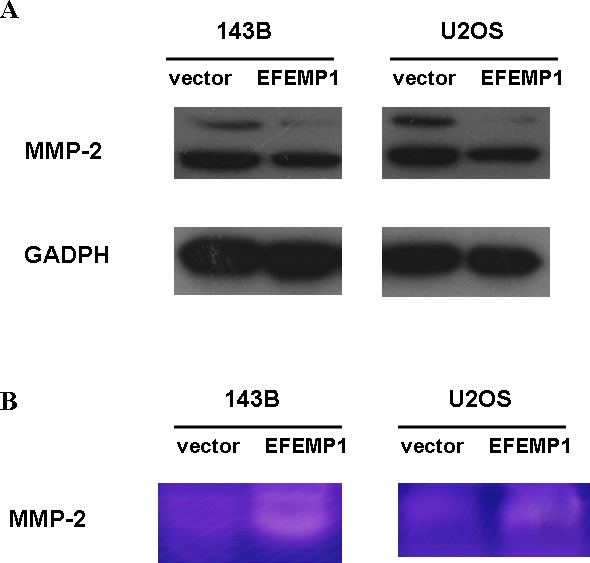
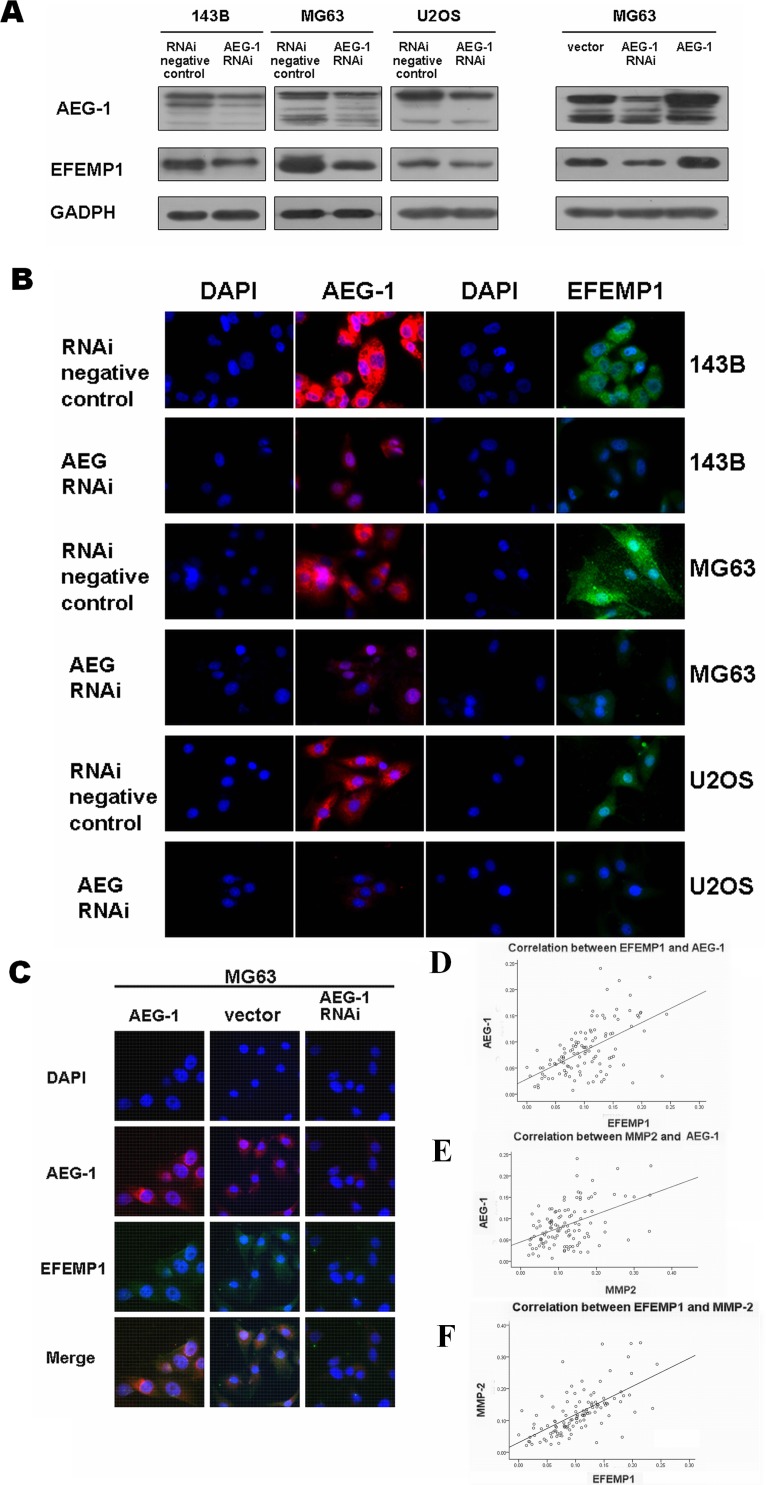
The role of epidermal growth factor-containing fibulin-like extracellular matrix protein 1 (EFEMP1) in osteosarcoma remains unknown. Then applying EFEMP1 siRNA, plasmids transfection and adding purified EFEMP1 protein in human osteosarcoma cell lines, and using immunohistochemistry on 113 osteosarcoma tissues, demonstrated that EFEMP1 was a poor prognostic indicator of osteosarcoma; EFEMP1 was specifically upregulated in osteosarcoma and associated with invasion and metastasis in vitro and in vivo. At the same time, we found a direct regulatory effect of EFEMP1 on MMP-2. Moreover, we firstly found the marked induction of EFEMP1 by oncogenic AEG-1. And EFEMP1 expression was inhibited by the selective inhibitor of NF-κB (PDTC) in osteosarcoma cells. Then we thought that NF-κB pathways might be one of the effective ways which EFEMP1 was induced by AEG-1. Thus, we suggested that EFEMP1 played a part as the mediator between AEG-1 and MMP-2. And NF-κB signaling pathway played an important role in this process. In summary, EFEMP1 was associated with invasion, metastasis and poor prognosis of osteosarcoma patients. EFEMP1 might indirectly enhance the expression of MMP-2, providing a potential explanation for the role of AEG-1 in metastasis. NF-κB pathways might be one of the effective ways which EFEMP1 was induced by AEG-1.

Keywords: AEG-1; EFEMP1; MMP-2; NF-κB; osteosarcoma.


Conflict of interest statement

CONFLICTS OF INTEREST

The authors confirm that there are no conflicts of interest.

Figures

Figure 1
Figure 1. Overexpression of EFEMP1 in osteosarcoma patients
(A) Immunohistochemistry of EFEMP1 in tissue specimens: EFEMP1 protein was upregulated in osteosarcoma sections compared with normal bone tissue, benign bone tumors and tumor-like bone lesions, as examined by immunohistochemical staining. EFEMP1 was specifically upregulated in osteosarcoma. (B) Expression levels of EFEMP1 in the group with hematogenous metastasis versus the group without; p = 0.011. (C) Kaplan–Meier curves showed overall survival according to EFEMP1 expression. High EFEMP1 expression (dotted line) was associated with poorer outcomes compared with low EFEMP1 expression (solid line). (D) Comparative quantification of EFEMP1 protein in paired primary osteosarcoma tissues (T) and adjacent non-tumor tissues (ANT), with each pair obtained from the same patient. Protein expression levels were normalized to GADPH.
Figure 2
Figure 2. Downregulation of EFEMP1 in osteosarcoma cell lines suppressed migration, invasion and colony formation in vitro
Small interfering RNA approaches to inhibit the endogenous expression of EFEMP1. (A) Quantification of EFEMP1 mRNA levels in EFEMP1 RNAi–transduced osteosarcoma cells. The mRNA expression levels are presented as the increasing fold compared with the negative control cells and were normalized to GAPDH. (B) Expression of EFEMP1 following application of siRNA approaches to inhibit the endogenous expression of EFEMP1 in osteosarcoma cell lines 143B, MG63 and U2OS, analyzed by western blot using an anti–EFEMP1 antibody. Protein expression levels were normalized to GADPH. (C) Reduced EFEMP1 expression inhibited the invasive ability of osteosarcoma cells. Representative pictures of penetrated cells in lower chamber (upper) and quantification of the indicated cells (lower) using the transwell matrix penetration assay. The 143B (2× 10⁴), MG63 (2× 10⁴) and U2OS (2× 10⁴) were added to the upper chamber in serum-free medium. Migrating cells were scored using a microscope at 100× magnification. Relative quantification of penetrated cells in lower chamber represents the mean of three different experiments. (D) Wound-healing assays of 143B osteosarcoma cell revealed that downregulation of EFEMP1 significantly inhibited cell migration compared with the control group. The relative migration distance at 24 hour of osteosarcoma cells were indicated in the bar chart. (E) Compared with the control groups, the number of colonies was significantly reduced in the EFEMP1 RNAi group. Each experiment was performed three times in triplicate. * P < 0.05, ** P < 0.01.
Figure 3
Figure 3. EFEMP1 expression promoted cell migration, invasion and colony formation in osteosarcoma cells in vitro
(A) Expression of EFEMP1 in osteosarcoma cell lines 143B and U2OS stably transfected with EFEMP1 expression plasmid, analyzed by western blot using an anti–EFEMP1 antibody. Protein expression levels were normalized to GADPH. (B) Quantification of EFEMP1 mRNA levels in osteosarcoma cell lines 143B and U2OS stably transfected with EFEMP1 expression plasmid. The mRNA expression levels are presented as the increasing fold compared with the empty vector control cells and were normalized to GAPDH. (C) Over-expression EFEMP1 expression significantly promoted the invasive ability of osteosarcoma cells. Representative pictures of penetrated cells in lower chamber (left) and quantification of the indicated cells (right) using the transwell matrix penetration assay. The 143B (0.5× 10⁴) and U2OS (2× 10⁴) were added to the upper chamber in serum-free medium. Migrating cells were scored using a microscope at 100× magnification. Relative quantification of penetrated cells in lower chamber represents the mean of three different experiments. (D) Wound-healing assays of osteosarcoma cells revealed that over-expression EFEMP1 expression significantly promoted cell migration compared with the empty vector control group. The relative migration distance was indicated in the bar chart. (E) Compared with the empty vector control groups, the number of colonies was significantly increased in the over-expression EFEMP1 expression group. Each experiment was performed three times in triplicate. * P < 0.05, ** P < 0.01.
Figure 4
Figure 4. Tumorigenicity of osteosarcoma cells that overexpress EFEMP1
(A) Tumorigenicity of the indicated stable transfectants that were injected with empty vector-143B (Left) or EFEMP1-143B cells(Right) when grown for 30 days in the nude mouse model (n = 8 mice per group). (B) The average weight of tumors derived from EFEMP1-143B cells group was only slight larger than that of empty vector control group. (C) H&E staining were performed on subcutaneous transplantation tumor on EFEMP1-143B cells group. Histologic examination shows the tumor was composed of highy pleomorphic cells. Tumor cells are large and spindle with central, oval nuclei and prominent nucleoli. It is easy to find the necrosis and mitotic. (D) H&E staining were performed on the lesions were the osteosarcoma metastasis tumor in lungs of EFEMP1-143B cells group (marking with the arrow). The morphology of metastatic tumor cells are similar with subcutaneous transplantation tumor cells.
Figure 5
Figure 5. EFEMP1 promotes tumor metastasis in vivo through experimental metastasis assay
(A) Metastatic nodules (arrows) on the surface of the lung(left). The number of visible tumor nodules were quantified on lungs of mice (right). (B) Metastatic nodules (arrows) on the surface of the liver (left). The number of visible tumor nodules were quantified on liver of mice (right).
Figure 6
Figure 6. EFEMP1-mediated tumor cell migration and invasion was linked to MMP-2
(A) MMP-2 protein levels increased in 143B and U2OS cells stably transfected with EFEMP1 expression plasmid compared with the empty vector control groups, as assessed by western blot analysis. (B) Conditioned medium harvested from treated osteosarcoma cells was analyzed by gelatin zymography. White bands represent MMP-2-mediated gelatin digestion. The results demonstrated that MMP-2 activity was increased in 143B and U2OS cells stably transfected with EFEMP1 expression plasmid compared with the empty vector control groups.
Figure 7
Figure 7. The relation between EFEMP1 and AEG-1
(A) Downregulation and upregulation of AEG-1 expression regulated the expression of EFEMP1 in osteosarcoma cell lines, as assessed by western blot analysis. The expression levels of AEG-1 increased after transfection of MG63 with pcDNA3.1-AEG-1 as compared with cells transfected with vector alone. Protein expression levels were normalized to GADPH. (B) Immunofluorescence microscopy was used to assess AEG-1 and EFEMP1 expression in osteosarcoma cell lines 143B, MG63 and U2OS after application of siRNA approaches to inhibit the endogenous expression of AEG-1. (C) Double immunofluorescence was performed to evaluate the colocalization of AEG-1 and EFEMP1 in MG63 cells. The expression levels of AEG-1 increased after transfection with pcDNA3.1-AEG-1. (D) The scatter diagram showed the strong correlation between EFEMP1 and AEG-1 expression based on Pearson's correlation analysis throught immunohistochemistry in osteosarcoma patients. (E) The scatter diagram showed the strong correlation between AEG-1 and MMP-2 expression based on Pearson's correlation analysis throught immunohistochemistry in osteosarcoma patients. (F) The scatter diagram showed the strong correlation between EFEMP1 and MMP-2 expression based on Pearson's correlation analysis throught immunohistochemistry in osteosarcoma patients.
Figure 8
Figure 8. PDTC suppressed EFEMP1 expression via inhibition of NF-κB signaling pathway in osteosarcoma cells
The basal level of Phospho-NF-κB p65 and EFEMP1 were decreased by treatment with 50 μM and 100 μM specific NF-κB inhibitor-PDTC in 143B, MG63 and U2OS osteosarcoma cells, without affecting NF-κB P65 and AEG-1, analyzed by western blot. Protein expression levels were normalized to GADPH.
Figure 9
Figure 9. PDTC suppressed EFEMP1 expression via inhibition of NF-κB signaling pathway in osteosarcoma cells
The treatment with PDTC(50 μM, 100 μM) partly suppressed the expression of Phospho-NF-κB p65, EFEMP1 and MMP-2 in osteosarcoma cells with pcDNA3.1-AEG-1 cells, without affecting NF-κB P65 and AEG-1, analyzed by western blot. Protein expression levels were normalized to GADPH.

References

    1. Timpl R, Sasaki T, Kostka G, Chu ML. Fibulins: a versatile family of extracellular matrix proteins. Nat Rev Mol Cell Biol. 2003;4:479–489. - PubMed
    1. Stone EM, Lotery AJ, Munier FL, Héon E, Piguet B, Guymer RH, Vandenburgh K, Cousin P, Nishimura D, Swiderski RE, Silvestri G, Mackey DA, Hageman GS, et al. A single EFEMP1 mutation associated with both Malattia Leventinese and Doyne honeycomb retinal dystrophy. Nat Genet. 1999;22:199–202. - PubMed
    1. Marmorstein LY, Munier FL, Arsenijevic Y, Schorderet DF, McLaughlin PJ, Chung D, Traboulsi E, Marmorstein AD. Aberrant accumulation of EFEMP1 underlies drusen formation in Malattia Leventinese and age-related macular degeneration. Proc Natl Acad Sci U S A. 2002;99:13067–13072. - PMC - PubMed
    1. Obaya AJ, Rua S, Moncada-Pazos A, Cal S. The dual role of fibulins in tumorigenesis. Cancer Lett. 2012;325:132–138. - PubMed
    1. Hu Y, Pioli PD, Siegel E, Zhang Q, Nelson J, Chaturbedi A, Mathews MS, Ro DI, Alkafeef S, Hsu N, Hamamura M, Yu L, Hess KR, et al. EFEMP1 suppresses malignant glioma growth and exerts its action within the tumor extracellular compartment. Mol Cancer. 2011;10:123. - PMC - PubMed

Publication types

MeSH terms