. 2015 Sep;14(9):2394-404.
doi: 10.1074/mcp.M114.046995. Epub 2015 May 17.

A Scalable Approach for Protein False Discovery Rate Estimation in Large Proteomic Data Sets

Affiliations

A Scalable Approach for Protein False Discovery Rate Estimation in Large Proteomic Data Sets

Mikhail M Savitski et al. Mol Cell Proteomics. 2015 Sep.

Abstract

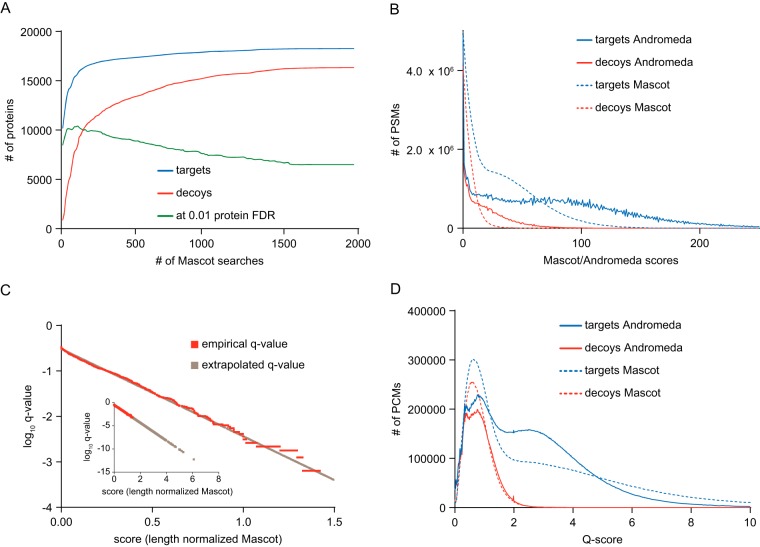
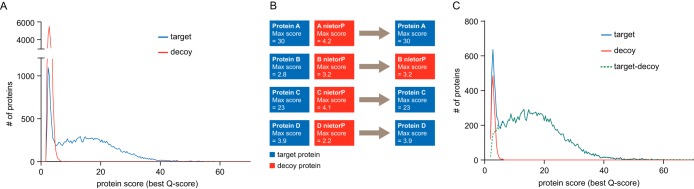
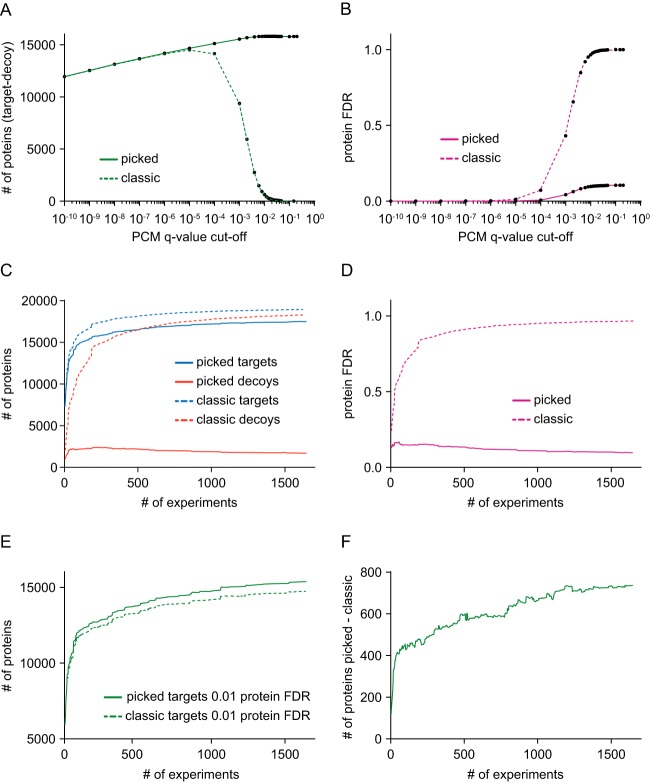
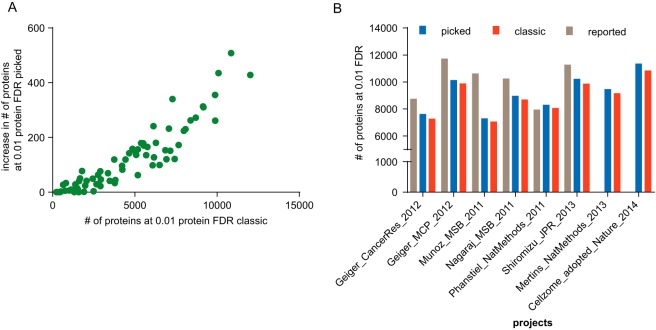
Calculating the number of confidently identified proteins and estimating false discovery rate (FDR) is a challenge when analyzing very large proteomic data sets such as entire human proteomes. Biological and technical heterogeneity in proteomic experiments further add to the challenge and there are strong differences in opinion regarding the conceptual validity of a protein FDR and no consensus regarding the methodology for protein FDR determination. There are also limitations inherent to the widely used classic target-decoy strategy that particularly show when analyzing very large data sets and that lead to a strong over-representation of decoy identifications. In this study, we investigated the merits of the classic, as well as a novel target-decoy-based protein FDR estimation approach, taking advantage of a heterogeneous data collection comprised of ∼19,000 LC-MS/MS runs deposited in ProteomicsDB (https://www.proteomicsdb.org). The "picked" protein FDR approach treats target and decoy sequences of the same protein as a pair rather than as individual entities and chooses either the target or the decoy sequence depending on which receives the highest score. We investigated the performance of this approach in combination with q-value based peptide scoring to normalize sample-, instrument-, and search engine-specific differences. The "picked" target-decoy strategy performed best when protein scoring was based on the best peptide q-value for each protein yielding a stable number of true positive protein identifications over a wide range of q-value thresholds. We show that this simple and unbiased strategy eliminates a conceptual issue in the commonly used "classic" protein FDR approach that causes overprediction of false-positive protein identification in large data sets. The approach scales from small to very large data sets without losing performance, consistently increases the number of true-positive protein identifications and is readily implemented in proteomics analysis software.


Figures

Fig. 1.
Fig. 1.
Breakdown of the classic TDS and q-value calculation for data harmonization. A, To illustrate the breakdown of the classic TDS we cumulatively aggregated 1970 Mascot search results (18754 raw files) filtered at 1% PSM FDR and calculated the number of proteins at 1% protein FDR at each step. Protein scores were derived by summing Mascot ion scores of the best peptide matches. The number of target (blue) and decoy (red) proteins saturated quickly, whereas the number of proteins at 1% protein FDR (green) reached its maximum at an early stage but then continuously decreased and stopped at fewer proteins than in the beginning. This indicates that the classic TDS is not working when dealing with large data. B, The Mascot (dashed) and Andromeda (solid) target (blue) and decoy (red) PSM score distributions show vast differences in the scoring scheme precluding their combination without prior normalization. C, To obtain continuous PCM q-values, we used a linear extrapolation model (black) trained on the empirically calculated PCM q-values (orange). The inset shows that after extrapolation, meaningful q-values can be assigned to PCMs that have a higher score than the best decoy. D, Following q-value extrapolation (Qscore is defined as −log10(q-value)), Mascot (dashed) and Andromeda (solid) target (blue) and decoy (red) q-value distributions align well, particularly in the q-value range where most false positive identifications are expected, and thus, allow the combination of the search results.
Fig. 2.
Fig. 2.
Protein FDR estimation using the classic and picked target–decoy strategy. A PCM q-value cutoff of below 0.01 was used. A, Using the number of decoy proteins from the classic TDS massively overestimates the number of false-positive protein identifications. This is apparent by the almost sixfold higher amplitude of the decoy (red) protein distribution in the low scoring region compared with that of the target proteins (blue). B, The picked TDS treats target and decoy sequences of the same protein as a pair. If the protein score of the target (blue) amino acid sequence is higher than that of the respective decoy (red) sequence, the target sequence is counted as a hit and the decoy sequence is discarded. Conversely, if the decoy sequence scores higher than the target sequence, it counts as a decoy hit and the target sequence is discarded. C, After applying the picked approach, the decoy (red) protein distribution superimposes with the target (blue) protein distribution that allows proper protein FDR estimation using the number decoy proteins, and yields a reasonable distribution of true protein hits (green dashed line), calculated as the difference between the distributions of target and decoy hits.
Fig. 3.
Fig. 3.
Comparison of the classic TDS to the picked TDS. First, we compared the performance of the picked (solid) and classic (dashed) approach when filtering the PCMs on various FDR cutoffs using the best PCM q-value as protein score. A, With increasing PCM q-value cutoffs, the number of true positive protein identifications (number of target proteins − number of decoy proteins) increases and is comparable between the picked and classic approach. At roughly 10−4 PCM q-value cutoff, the number of true positive proteins starts to decrease and quickly drops to almost zero for the classic approach, whereas true positive proteins IDs increase further and converges at stable plateau of 15,817 proteins in the picked approach. B, The estimated protein FDR of the classic and picked approach mirrors the trend seen in panel A. Although the estimated protein FDR increases constantly when increasing the PCM q-value cutoff and eventually reaches 100%, the picked approach starts to rise much later and plateaus at roughly 10%. C, Then we compared the classic and picked approach when accumulating experiments. The cumulative number of target (blue) protein identifications of the classic and picked approach increases with more data, whereas the classic approach saturates more rapidly and reports higher numbers of proteins. Conversely, although the number of decoy (red) protein identifications reported by the classic approach saturate and approach the number of target proteins, the number of decoy proteins reported by the picked approach quickly reaches a maximum and decreases when adding more experiments. D, This is again mirrored in the estimated overall protein FDR of the picked and classic approach. E, The number of proteins identified at 1% proteins FDR is increasing in both picked and classic approach, but the picked approach consistently reports higher numbers of proteins. F, The difference between the number of proteins reported at 1% proteins FDR between the picked and classic approach increases with increasing number of experiments reaching close to 800 proteins.
Fig. 4.
Fig. 4.
Effects of the picked approach on focused data sets. A, To investigate the effect of the picked approach on studies of varying size, we plotted the increase of confidently identified proteins using the picked approach versus the number of proteins reported by the classic approach for 76 data sets (green dots). The picked approach invariably identifies more proteins than the classic approach and the difference increases with the number of proteins identified in a given data set. B, Reassessment of the number of proteins reported in a number of publications showed that the picked approach (blue) identified more proteins than the classic approach (red). It is also evident that the picked TDS is more conservative than the number of proteins reported in many of these publications (gray).

References

    1. Scheltema R. A., Hauschild J. P., Lange O., Hornburg D., Denisov E., Damoc E., Kuehn A., Makarov A., Mann M. (2014) The Q Exactive hf, a benchtop mass spectrometer with a prefilter, high performance Quadrupole, and an ultra-high field Orbitrap analyzer. Mol. Cell. Proteomics 13, 3698–3708 - PMC - PubMed
    1. Kelstrup C. D., Jersie-Christensen R. R., Batth T. S., Arrey T. N., Kuehn A., Kellmann M., Olsen J. V. (2014) Rapid and deep proteomes by faster sequencing on a benchtop Quadrupole ultra-high-field Orbitrap mass spectrometer. J. Proteome Res. 3, 6187–95 - PubMed
    1. Helm D., Vissers J. P., Hughes C. J., Hahne H., Ruprecht B., Pachl F., Grzyb A., Richardson K., Wildgoose J., Maier S. K., Marx H., Wilhelm M., Becher I., Lemeer S., Bantscheff M., Langridge J. I., Kuster B. (2014) Ion mobility tandem mass spectrometry enhances performance of bottom-up proteomics. Mol. Cell. Proteomics 13, 3709–3715 - PMC - PubMed
    1. Yamana R., Iwasaki M., Wakabayashi M., Nakagawa M., Yamanaka S., Ishihama Y. (2013) Rapid and deep profiling of human induced pluripotent stem cell proteome by one-shot NanoLC-MS/MS analysis with meter-scale monolithic silica columns. J. Proteome Res. 12, 214–221 - PubMed
    1. Hebert A. S., Richards A. L., Bailey D. J., Ulbrich A., Coughlin E. E., Westphall M. S., Coon J. J. (2014) The one hour yeast proteome. Mol. Cell. Proteomics 13, 339–347 - PMC - PubMed

LinkOut - more resources