. 2015 May 19:6:7051.
doi: 10.1038/ncomms8051.

Allele-specific analysis of DNA replication origins in mammalian cells

Affiliations

Allele-specific analysis of DNA replication origins in mammalian cells

Boris Bartholdy et al. Nat Commun. .

Abstract

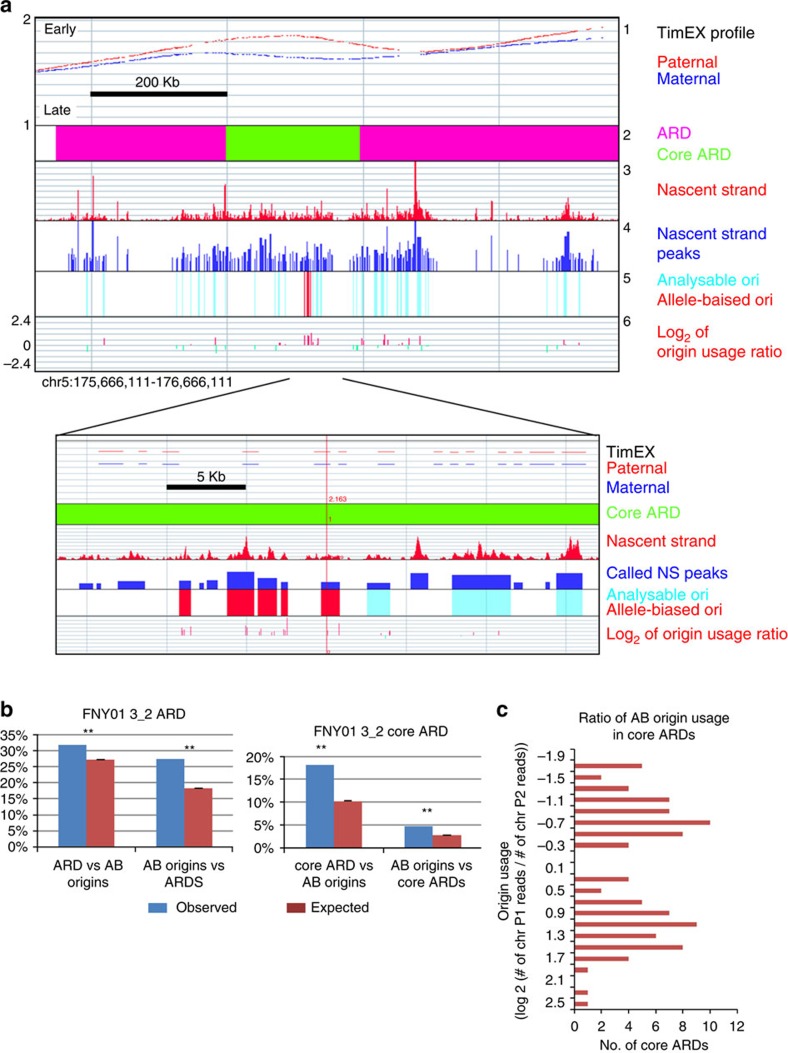
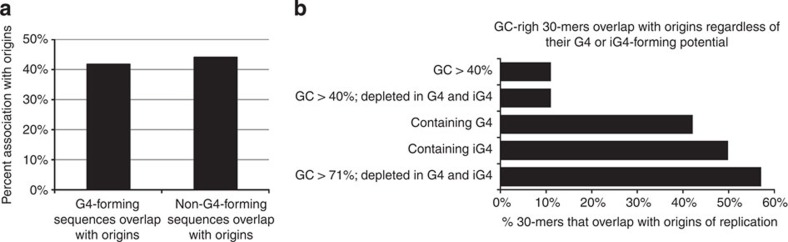
The mechanisms that control the location and timing of firing of replication origins are poorly understood. Using a novel functional genomic approach based on the analysis of SNPs and indels in phased human genomes, we observe that replication asynchrony is associated with small cumulative variations in the initiation efficiency of multiple origins between the chromosome homologues, rather than with the activation of dormant origins. Allele-specific measurements demonstrate that the presence of G-quadruplex-forming sequences does not correlate with the efficiency of initiation. Sequence analysis reveals that the origins are highly enriched in sequences with profoundly asymmetric G/C and A/T nucleotide distributions and are almost completely depleted of antiparallel triplex-forming sequences. We therefore propose that although G4-forming sequences are abundant in replication origins, an asymmetry in nucleotide distribution, which increases the propensity of origins to unwind and adopt non-B DNA structure, rather than the ability to form G4, is directly associated with origin activity.


Figures

Figure 1
Figure 1. Allele-specific NS analysis.
(a) GenPlay genome browser screenshot illustrating allele-specific NS sequencing analysis. Track 1: uniquely aligned NS reads binned in 10-bp windows. Track 2: background track obtained by sequencing DNA from control white blood cells from same individual. Track 3: peaks (dark blue) and subpeaks (light blue) called using the MACS software. Tracks 4 and 5: allele depth of phased heterozygous SNPs in FNY01_2_2 in chromosomes P1 (track 4) and P2 (track 5). The red rectangle highlights an allele-biased origin of replication (see text). (b) Circos plot illustrating the location of all allele-biased origins. Green (inner) circle: location of all origins analysable in an allele-specific manner. Outer circle shows the log2 ratio of P1/P2 reads in allele-biased origins (blue, negative; yellow, positive values).
Figure 2
Figure 2. Asynchronously replicated regions (ARDs) are enriched in allele-biased origins of replication.
(a) Track 1: timing of replication profile of a genomic region containing a 1-Mb ARD. The blue and red curves, respectively, represent the TimEX profiles of the maternal and paternal chromosomes. The y axis represents the S/G1 TimEX ratio, which is proportional to the replication time during S phase. The TimEX ratio is the ratio of the number of reads observed in the S and G1 phase of the cell cycle and was calculated in 5,000-bp windows genome-wide. Track 2: pink, ARD; green, core ARD. Track 3: NS profile (binned in 10-bp windows). Track 4: NS peaks called by MACS. Track 5: light blue: analysable origins (that is, origins overlapping at least 50 SNP-containing reads); red: allele-biased origins (origins with statistically different number of reads on both alleles (FDR<0.05)). Track 6: log ratio of the number of reads observed in P1 and P2. Zoomed-in region: same as above but magnified 40 times. (b) ARDs and core ARDs are enriched in allele-biased origins of replication. Left histograms: per cent ARDs that contain allele-biased origins. Right histograms: per cent core ARDs that contain allele-biased origins (AB origins). Blue bars, observed values; red bars, expected values. Stars indicate that the differences between observed and expected values were significant (permutation P value <0.001). Expected values and P values were calculated by performing 10,000 permutations. Error bars represents s.e.m of permutations. (c) Histogram illustrating the distribution of allele bias in origins located within core ARDs. x axis, number of core ARDs; y axis=log2(number of reads on chr P1/number of reads on chr P2).
Figure 3
Figure 3. Number of G4s in allele-biased origins does not correlate with origin usage.
(a) A G4 quadruplex at position 114,130,205–1,114,130,249 on chr 11 is present on chr P1 but not on chr P2 because of a G to A transition that destroys the third triplet of Gs. Tracks 1 and 2 illustrate the number of reads containing a G or an A at that position. Tracks 3 and 4 illustrate an SNP that alters a G4-forming sequence. Track 5 illustrates the sequence of the G4. Black rectangles highlight the four triplets of G and the G to A SNP. (b) Presence of G4s does not correlate with origin activity. Left histogram: x axis, number of origins containing one or more polymorphic G4. Right histogram: same but restricted to origins containing at most 1 G4. Additional G4s created by SNPs or indels are about equally distributed between the least and most active alleles.
Figure 4
Figure 4. Intermolecular iG4s are highly enriched in origins of replication but their presence does not correlate with origin usage.
(a) Origins of replication contain more iG4s than expected by chance. Bar plot illustrating the association between G4s, iG4s and origins of replication. y axis, per cent of origins associated with G4s, iG4s or both. Black bars: observed association, striped bars: association expected by chance (10,000 permutations). Stars indicate that the differences between observed and expected values were significant (permutation P value <0.001). (b) Presence of iG4s does not correlate with origin activity. Top plot: x axis, number of origins containing one or more polymorphic iG4. Middle plot: same as above but restricted to origins containing at most 1 iG4. Bottom plot: same but restricted to origins containing no G4s and at most one iG4.
Figure 5
Figure 5. Origins of replication are associated with GC-rich regions independently of their G4-forming potential.
(a) Control sequences with the same length distribution and the same GC-content as G4- and iG4-forming sequences are as strongly associated with origins as G4- or iG4-forming sequences. (b) Origins of replication are associated with GC-rich 30-mers independently of their G4-forming potential. Bar plots illustrating the per cent overlap between 30-mers with GC-content >40% (top bar), 30-mers with GC-content >40% depleted in G4s and iG4s (second bar), 30-mers containing G4s or iG4s (third and fourth bars), 30-mers with GC-content >71% depleted in G4- and iG4-forming sequences.
Figure 6
Figure 6. Origins are strongly skewed and depleted in antiparallel triplex-forming sequences.
(a) Histogram illustrating G-density in origin subpeaks. Mean density on the reference allele are shown for the top 3,000 origin subpeaks. The bimodal distribution reflects the fact that the G-rich strand is either on the plus or minus strand. Origins have a highly biased G- and C-content. (b) k-means clustering of G-density (k=4) in origins of replication. The size of the G-rich region varies from about 200 bp to 1 kb. The 200-bp regions at the centre of the top 3,000 origin subpeaks are G-rich (on either the plus or minus strand). Many origins exhibit much longer G-rich regions. (c) Density plots of G/C skew in origin subpeaks stratified by efficiency. Black curve, adjusted G/C skew of the top 100 most efficient origins (0.1 k). Grey line: adjusted G-density for the top 1,000 origins (1 k) and so on. G/C skew was adjusted by reverse complementing the origins in which the G-rich strand was the minus strand (see methods). Highly efficient origins contain large 200–500-bp skewed regions. The size and the amount of skew progressively decrease in less-efficient origins. y axis=GC skew (G-C/G+C). (d) Histogram depicting the proportion of skewed origins. Top 10,000 origin subpeaks were analysed by intersecting the origin subpeak with a track containing all G/C or A/T skewed regions in the human genome that are greater than 400 bp. Expected values were calculated by permutations. Stars indicate that the differences between observed and expected values were significant (permutation P value <0.001). (e) Histogram illustrates the per cent origins of replication that contain a triplex-forming sequence. Triplex-forming sequences were detected using Bioconductor package Triplex and intersected with origins of replication. Types 0–3 are parallel triplex, while types 4–7 are antiparallel. Antiparallel triplexes are found in origins <10 times as often as would be expected by chance. Stars indicate that the differences between observed and expected values were significant (permutation P value <0.001).

References

    1. Hatton K. S. et al. Replication program of active and inactive multigene families in mammalian cells. Mol. Cell. Biol. 8, 2149–2158 (1988). - PMC - PubMed
    1. Epner E., Forrester W. C. & Groudine M. Asynchronous DNA replication within the human beta-globin gene locus. Proc. Natl Acad. Sci. USA 85, 8081–8085 (1988). - PMC - PubMed
    1. Woodfine K. et al. Replication timing of the human genome. Hum. Mol. Genet. 13, 191–202 (2004). - PubMed
    1. Hiratani I. et al. Global reorganization of replication domains during embryonic stem cell differentiation. PLoS Biol. 6, e245 (2008). - PMC - PubMed
    1. Farkash-Amar S. et al. Global organization of replication time zones of the mouse genome. Genome Res. 18, 1562–1570 (2008). - PMC - PubMed

Publication types

Associated data